

“[A] recession involves a significant decline in economic activity that is spread across the economy and lasts more than a few months.” National Bureau of Economic Research Business Cycle Dating Committee
The press is abuzz with claims that the United States is in recession because real GDP declined in both the first and second quarters of 2022. Many people use this “two consecutive quarters of declining GDP” formula as an informal indicator of a recession. And, they are generally right, it has been useful: since 1950, nine of 11 recessions designated by the National Bureau of Economic Research (NBER) Business Cycle Dating Committee (BCDC) included at least two consecutive quarters of falling GDP. Moreover, given the recent slowdown in economic activity, people are starting to feel as if they are experiencing a recession. Indeed, going forward, we expect that a recession will be associated with the disinflation which the Federal Reserve seeks (see our recent post).
Nevertheless, in current circumstances, there are good reasons not to rely on the simple recipe that equates two consecutive quarters of falling GDP with a recession. Indeed, when people ask us whether the economy currently is in a recession—something that occurs daily—we respond: “not yet, but very likely over the next year.”
In this post, we provide a primer on the criteria that the NBER BCDC uses to produce the authoritative dating of U.S. recessions. (The complete NBER cyclical chronology is here.) We explain how economists improve upon the simple formula by using multiple sources of information that are observed frequently and are less prone to large revisions—especially around business cycle turning points. We conclude with a brief explanation of why the risk that the United States will enter a recession in the near future is very high.
Beginning with the NBER’s definition of a recession (see the opening citation), the focus is on the three D’s of an economic downturn: depth, diffusion and duration. The standard for depth requires that the decline must be big enough, but there is no precise threshold. The diffusion benchmark means the downturn must be widespread both across economic sectors and geographically. Finally, meeting the duration standard means it must be “more than a few months” long. In practice, the BCDC allows for some substitutability across the three D’s: for example, the March 2020 COVID recession was only two months long, but it was the sharpest and broadest decline in U.S. economic activity since the Great Depression of the 1930s.
So, how can we identify recessions? You might think that as the most comprehensive measure of economic activity, we would start with real GDP. However, GDP has significant limitations. First, it is only available quarterly. So, if we were to rely solely on GDP, we would not be able to date the month that a recession starts and ends. Second, GDP is frequently revised: following the initial GDP release in the month following the quarter—say, July for the second quarter—the data are revised in August and in September, followed by annual revisions for a couple of years, with more comprehensive revisions roughly every five years (the last one was in 2018).
Revisions to GDP are not only frequent, but they are also large. For the period from 1966 to 2019, the revisions to economic growth for quarter t between the t+3 month estimate and the latest estimate ranged from minus 6.4 to plus 7.7 percentage points (authors’ calculations based on vintage GDP data here). The mean absolute revision was 1.5 percentage points, while the standard deviation was 2.0 percentage points. Moreover, GDP revisions can be especially important around cyclical turning points. Consider, for example, economic growth in the third quarter of 1990. The initial reading (reported in October 1990) showed positive growth of 1.8%; two years later, the estimate was minus 1.6%; and over the next 30 years, the number was revised eight more times, most recently in 2018 when the estimate of growth during 1990 Q3 was raised from +0.1% to +0.3%. We care because the NBER identifies July 1990 as the start of a recession.
The lesson is that, while GDP is important and useful, we do not observe it frequently enough or with sufficient accuracy to use it as the primary indicator of business cycle changes.
One way to “correct” cyclical signals from real GDP is to compare it with real GDI (gross domestic income). In theory, since they are simply different ways of aggregating economic activity (production equals income), GDI should be the same as GDP. In practice, however, they differ, and the gap between them—the statistical discrepancy—can be large. Indeed, the latest reading for GDI—for the first quarter of 2022—showed an increase of 1.8% at a seasonally adjusted annual rate, leaving it a remarkable 3.4% above GDP. Second-quarter GDI will be reported for the first time on August 25. Unless the first-quarter GDI estimate is revised substantially lower, we already know that there will not be two consecutive quarters of falling GDI, casting doubt on the GDP signal.
Indeed, if we were compelled to select only one measure to identify the start of a recession, it would not be real GDP. The real-time Sahm index is the better choice: it identifies the start of a recession as the month in which the three-month moving average of the unemployment rate rises by at least 0.5 percentage points above its 12-month low (see our earlier note). To be sure, the unemployment rate is a lagging, not a leading, indicator. Yet, unemployment rates are reported shortly after the end of each month, and revisions are both infrequent and small. Partly as a result, since 1960, the real-time Sahm index not only has picked out each NBER recession, but generally has done so early in the downturn (on average, within four months of the start). It also has provided zero false signals: that is, there have been no “Sahm red alerts” without a recession.
Today, the Sahm index shows no recession warning at all: the three-month moving average of the U.S. unemployment rate equals its 12-month low of 3.6%. To get some sense of how far we are from meeting this test, consider that the unemployment rate would have to rise to 4.1% and stay there (or climb higher) for three consecutive months during the next year for the Sahm indicator to signal a recession.
Instead of focusing on a single indicator like GDP, GDI, or the unemployment rate, economists identify the start and end dates for recessions by using a range of cyclical data. Efforts to characterize and measure business cycles go back to the detailed 1913 explorations by Wesley Clair Mitchell and to the pioneering and comprehensive work of Mitchell and Arthur Burns (Measuring Business Cycles) published by the NBER in 1946. In their words, “a cycle consists of expansions occurring at about the same time in many economic activities, followed by similarly general recessions [...]; this sequence of changes is recurrent but not periodic [...]” (see page 3 here).
Today, the NBER BCDC carries on the work of Burns and Mitchell as the official arbiter of U.S. business cycle dates in the economics profession. For this purpose, the BCDC generally uses the following six monthly series: real personal income less transfers; nonfarm payrolls; real personal consumption expenditures; real manufacturing and trade sales; household employment; and industrial production. In some cases (such as the brief COVID recession that began in March 2020), the Committee also may employ higher frequency data, such as weekly unemployment claims, to guide its monthly chronology. And, the committee uses both GDP and GDI in determining the quarterly business cycle chronology.
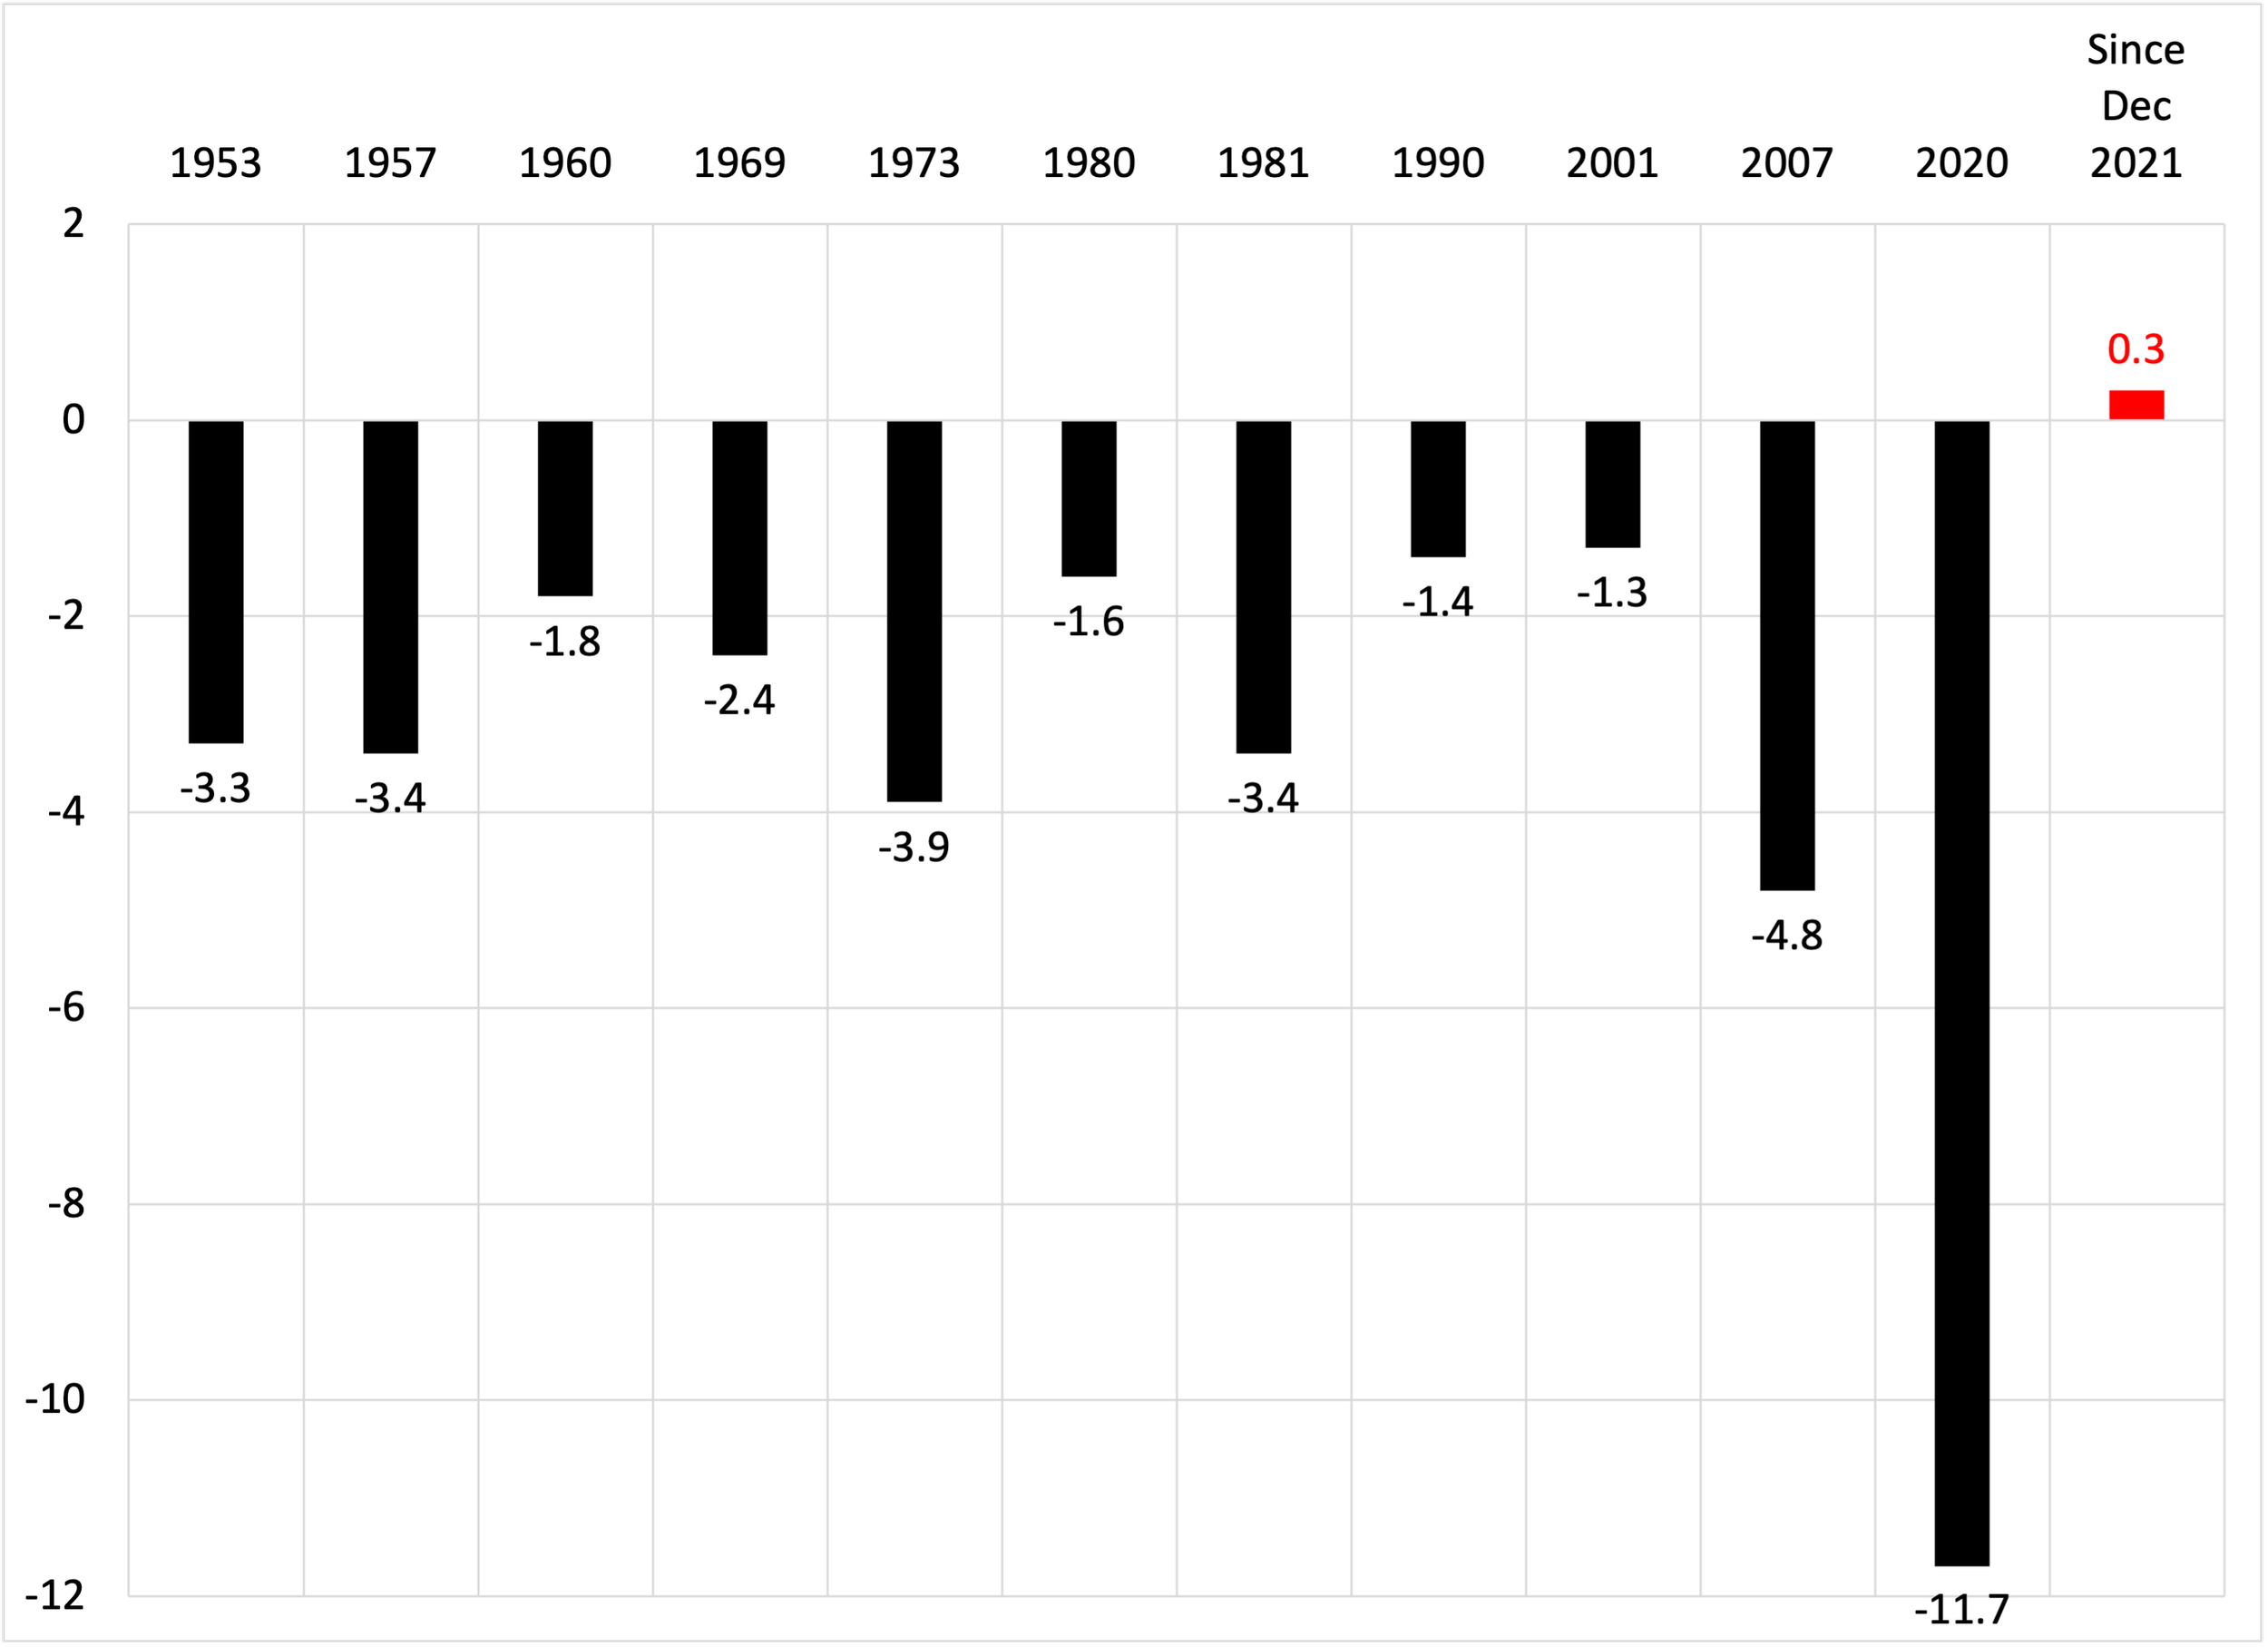
What do the BCDC’s list of indicators tell us about the current state of the business cycle? In the following chart, the black bars show the median percent changes for each monthly series (as well as for quarterly GDP and GDI) during the 11 NBER-designated recessions since 1950. For each of these indicators, the median response during recessions is a significant decline. In contrast, the red bars show the changes in these indicators since December 2021—the period when the two-consecutive-quarter decline of GDP supposedly signals recession. Importantly, the only declines in this recent period are in GDP and in manufacturing and trade sales (while personal income was virtually unchanged).
Median change of cyclical indicators during recessions since 1950 vs. change since December 2021 (percent)

Notes: Personal income becomes available in 1959, manufacturing and trade sales in 1967, and PCE in 2002. The other indicators are available from 1950. GDI is available through 1Q 2022 and manufacturing and trade sales through May 2022. The other indicators are available through the first half of 2022. Sources: BEA, BLS, Federal Reserve, NBER BCDC, and authors’ calculations.
What most distinguishes recent experience from past recessions is the strong performance of the labor market. Not only is it extraordinarily tight (see our recent post), but there is still considerable job creation under way. Monthly nonfarm payroll gains averaged 457 thousand this year. This is nearly three times the 2019, pre-pandemic rate of 164 thousand—a time when observers generally agreed that the labor market was tight. Compared to nonfarm payrolls, employment measured by the household survey has been softer in recent months—more consistent with the slowdown in many cyclical indicators. Nevertheless, the ratio of household employment to the labor force—a measure that declined in every recession since 1950 (see the following chart)—rose over the first half of 2022.
Change of employment ratio in recessions since 1950 and in period since December 2021 (percent)
Source: BLS, NBER BCDC and authors’ calculations.
The bottom line is that—the GDP declines notwithstanding—unless there are substantial downward revisions to a range of recent data, we are currently not in a recession.
Yet, the outlook remains quite unfavorable. The economy is clearly slowing, leaving it vulnerable to further adverse shocks. In addition, trend inflation still appears to be rising: our preferred measure (the Dallas Fed trimmed mean PCE inflation) increased to 4.8% at an annual rate over the six months ending June 2022. That is the highest reading since October 1982. Unsurprisingly, rapidly rising prices are weakening confidence both among consumers and firms, big and small.
Absent a recession, a large, favorable supply shock, or some combination of the two, we doubt that the Fed will achieve the nearly-three-percentage-point disinflation policymakers seek (to return to their 2% inflation target) by raising the policy rate merely to the 3% to 3½% range that investors appear to expect. In our view, they will need to tighten by more. It is no wonder that many observers are watching high-frequency cyclical data, such as weekly unemployment claims, for clear signs that a downturn has begun. Indeed, without such a downturn, investors who have begun to anticipate Fed easing in 2023 are very likely to be disappointed.
Against these worrisome prospects, the debate over whether we currently are in a recession seems secondary. Even so, the consecutive declines in first- and second-quarter real GDP are a useful teaching moment, helping us to clarify what a recession is and what it isn’t.