

“Our overarching focus is using our tools to bring inflation down to our 2 percent goal and to keep longer-term inflation expectations well-anchored.”
Federal Reserve Chairman Jerome Powell, Press Conference following FOMC meeting, June 15, 2022.
Acting too little too late has costs. Entrepreneurs lose businesses. Farmers lose harvests. Doctors lose patients.
Central bankers that act too little too late risk inflation, recession, or both. Everyone, including the members of the Federal Open Market Committee, knows that the FOMC is late in its current campaign to restore price stability. This makes it essential that they do not do too little.
Against that background, claims that a 75-basis-point rate hike—the biggest in nearly 30 years—represents an aggressive shift to a hawkish stance are entirely misleading, confusing changes with levels. Policy itself remains accommodative, stimulating the economy rather than holding it back. In practice, policy inaction followed by a large catch-up fuels uncertainty, which is now reflected directly in inflation surveys and indirectly in plunging consumer confidence and record google searches for both inflation and recession. Frequent, larger rate hikes are now an awkward, but necessary response to being late.
With inflation setting 40-year records and the labor market remaining tight, the obvious question is: why isn’t monetary policy already meaningfully restrictive? As Chair Powell noted, even after its latest actions to raise the target range for the federal funds rate to 1½% to 1¾%, the FOMC still has a ways to go just to reach the roughly 2½% rate that the FOMC considers appropriate were inflation at 2% and the labor market at full employment (see the latest Summary of Economic Projections, SEP). Not only that, but amid a variety of large adverse supply shocks that could drive inflation up even further, policymakers risk falling further behind in their pledge to restore price stability.
In our view, the Fed remains unduly optimistic about inflation prospects. To be sure, as actual inflation far surpassed their expectations over the past nine months, FOMC participants raised their inflation projections for the end of 2022 significantly (see following chart). Yet, the Committee still foresees a large and virtually costless disinflation. According to the SEP median projections, as inflation falls sharply over the next 30 months, the unemployment rate will do no more than glide back to a more sustainable level just above 4%. All this, while the target interest rate rises to between 3½% and 4% during 2023. Following this remarkable achievement—a true soft landing—FOMC expects to ease policy in 2024.
FOMC participants’ projections for end-2022 core PCE inflation
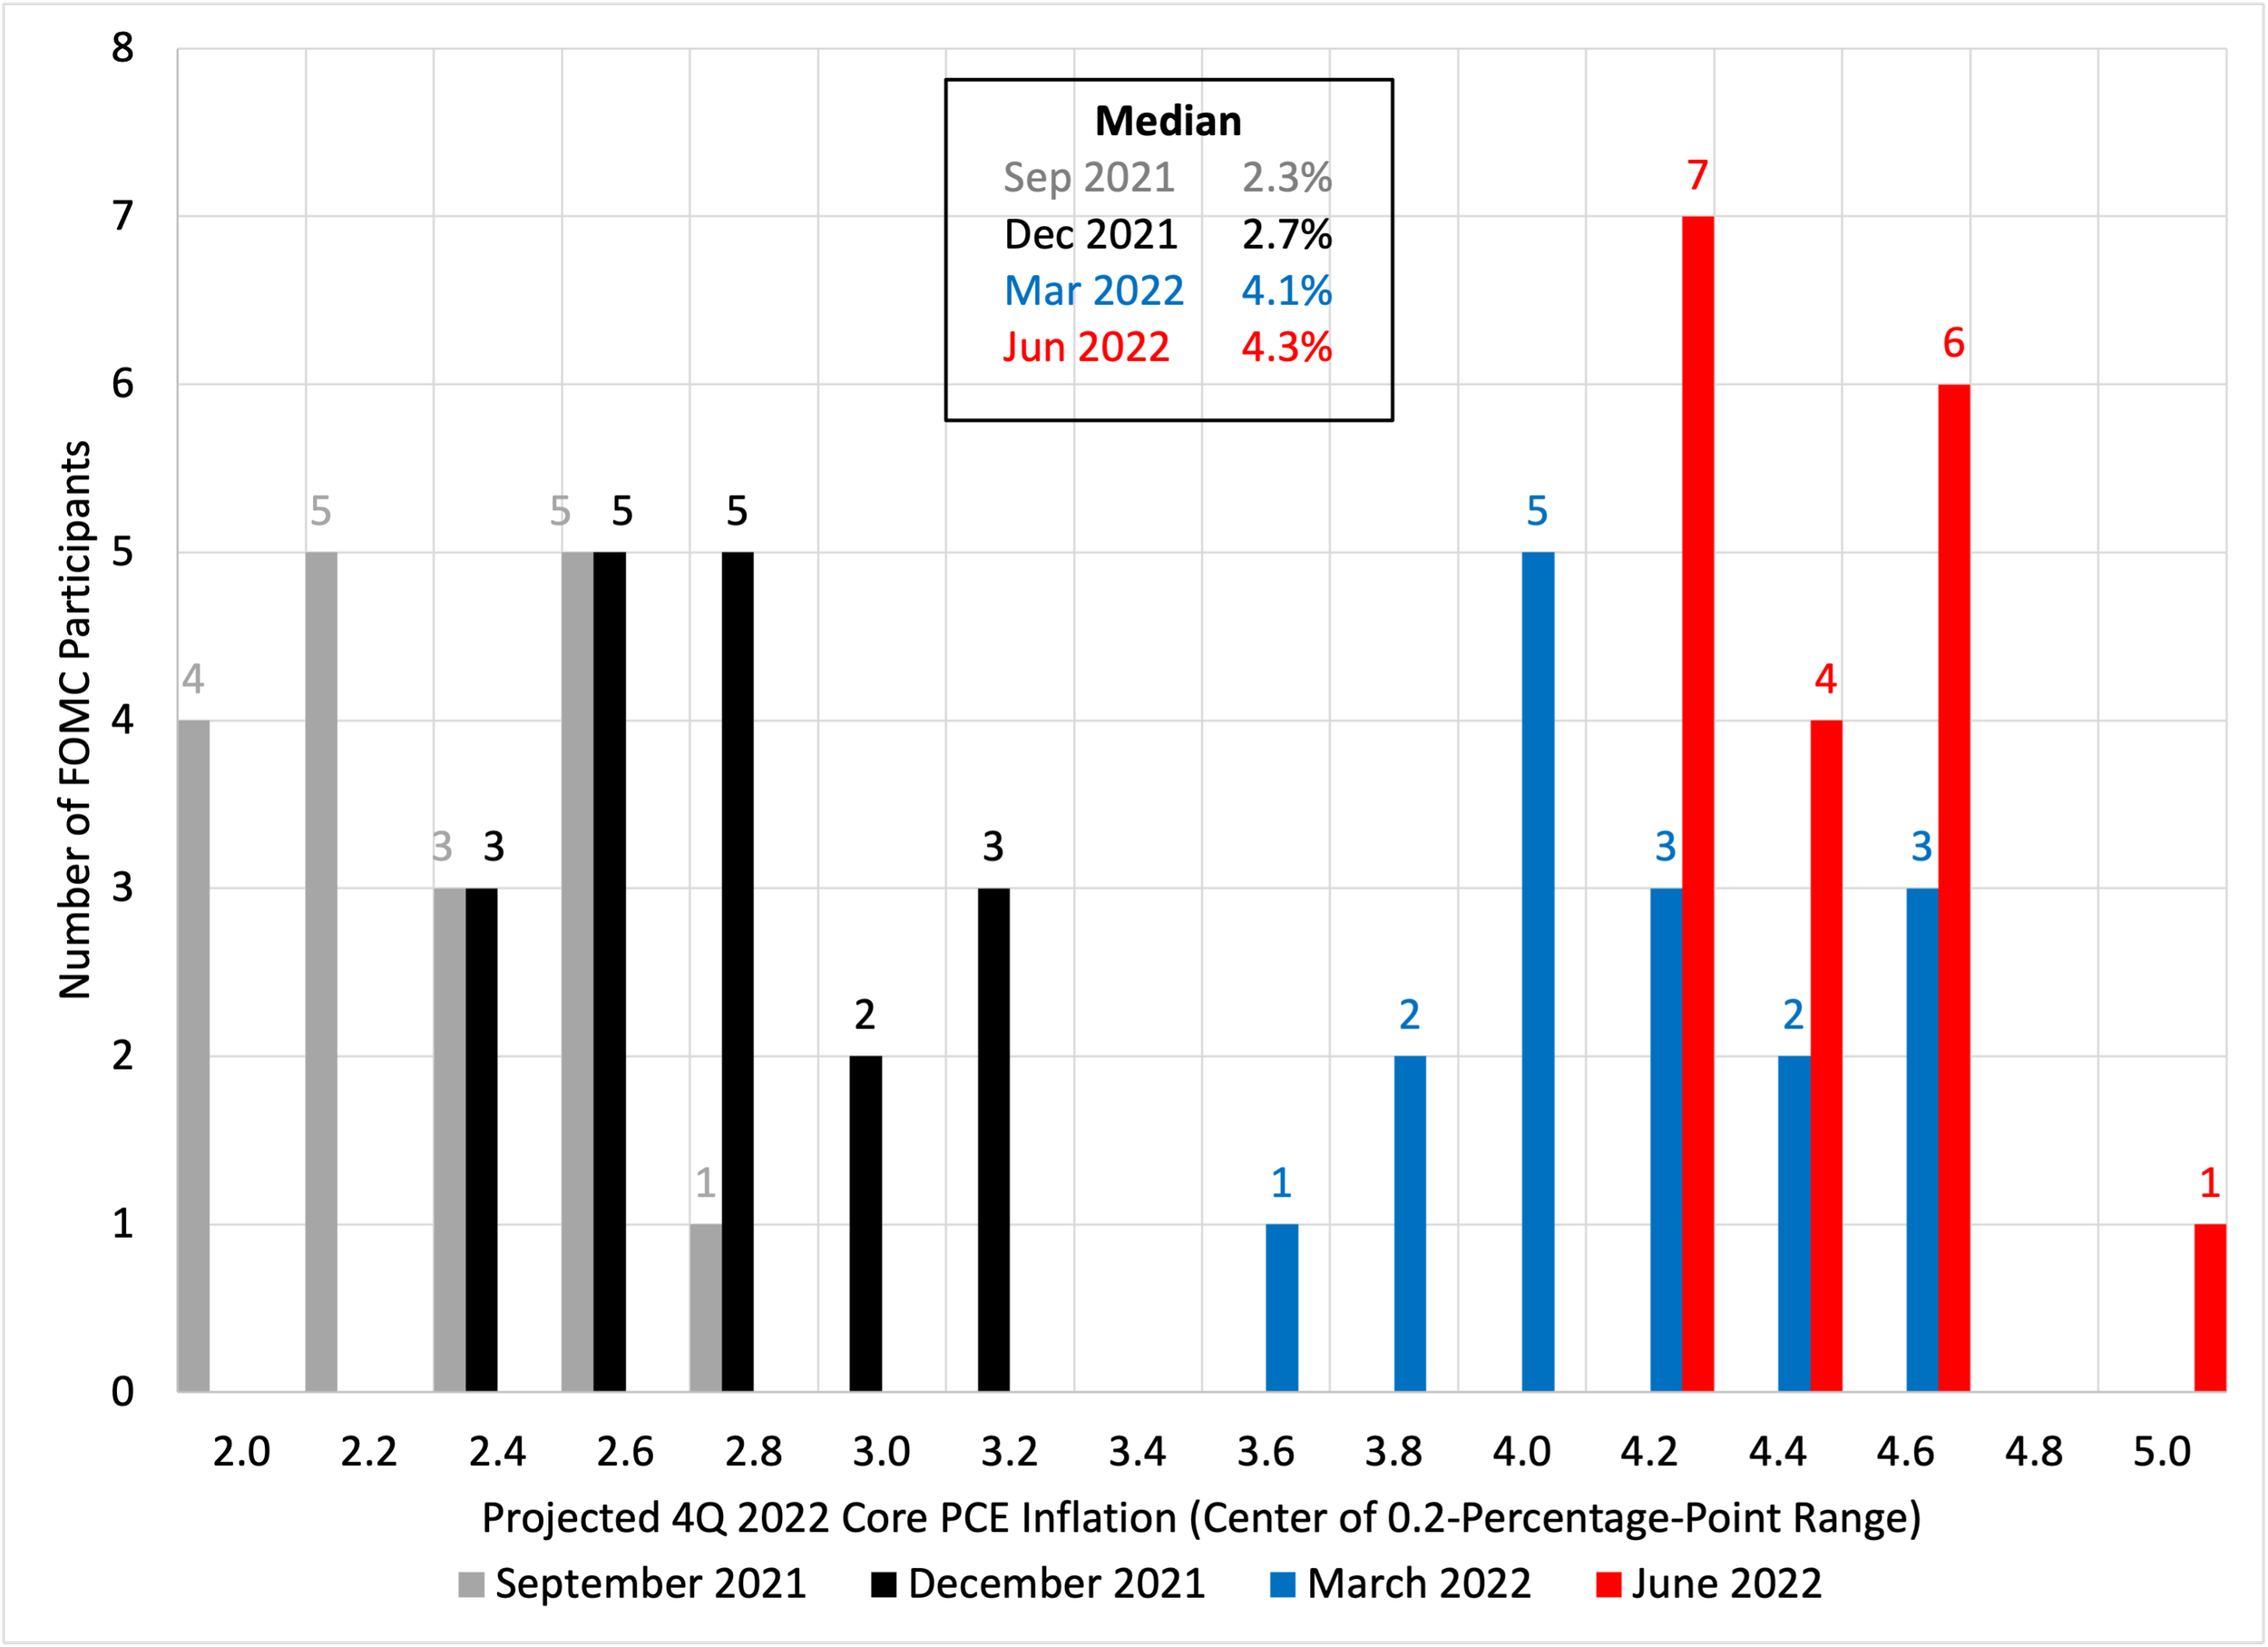
Note: Inflation projections are for the price change from the fourth quarter of 2021 to the fourth quarter of 2022. Source: FOMC Summary of Economic Projections, various editions.
In this post, we highlight the continued gap between the lessons of past disinflations and the Fed’s hopes and aspirations. We find it difficult to square the FOMC’s projections of falling inflation with only modest policy restraint. Simply put, we doubt that the peak projected policy rate will be sufficient to lower inflation to 2% in the absence of a recession. In our view, boosting the credibility of the FOMC’s price stability commitment will require not only greater realism, but a clarification of how policy would evolve if, as in past large disinflations, the unemployment rate rises by several percentage points. The overly sanguine June SEP simply does not address this key question. Indeed, no FOMC participant anticipates the unemployment rate to rise above 4½% over the forecast horizon. (We note the contrast between the SEP and the New York Fed staff’s model, which predicts a mild recession and implies a peak unemployment rate in the range of 5½%.)
Let’s start by briefly describing the inflation landscape. We then examine past disinflations, which serve as a guide for interpreting the current and likely future configuration of policy, inflation, and unemployment. Finally, we close by showing how far behind the Fed remains compared to what a simple policy rule suggests will be necessary to restore price stability.
First, both headline and core measures of inflation matter. Since the Fed became a de facto inflation targeter in the mid-1980s, volatile energy and food prices have had far less impact on inflation’s trend. The latter is more closely tracked by ex-food-and-energy (core) prices or by purely statistical measures, such as the trimmed mean. But the fact that, over the past quarter century, inflation deviations from its 2% target were short-lived likely reflects the Fed’s aggressive actions in the early 1980s, when it tolerated what at the time was the deepest recession since World War II. In our view, that hard-earned credibility helped steady long-term inflation expectations even amid large shocks (such as the oil price jump in 2008 and the financial-crisis-induced drop in prices the following year). Not coincidentally, the correlation between oil prices and core inflation (measured by the price index of personal consumption expenditures, PCEPI) plunged from 0.40 in the 1970-84 period to just 0.02 from 1985 to 2019.
To be sure, there is little that a central bank can do in the short term to counter temporary supply-driven price shocks. Monetary policy affects aggregate demand, not supply. By altering the balance between demand and supply, policymakers determine trend inflation over time. However, as was the case before 1985, even short-run adverse supply shocks have the potential to boost long-term inflation expectations, becoming ingrained in ways that drive up the trend. When that happens, when higher inflation becomes embedded in wage and price setting, it makes the central bank’s job of restoring price stability substantially more difficult. It is for this reason that the FOMC is so concerned about recent indications of rising long-term inflation expectations, such as those in the latest Michigan survey.
Second, inflation already has broadened into sectors where it is likely to persist. For example, the easing of the pandemic has prompted a shift of spending back toward services, fueling a pickup of services inflation. Moreover, inflation in key components of services—especially shelter—tend both to lag and then remain high after rising. We note with concern that, as a consequence of the ongoing surge in house prices and rents, Bolhuis, Cramer and Summers (2022a) anticipate residential price inflation (more than 17% of the core PCEPI) to approach 7% this year and to remain high in 2023. More broadly, statistical measures of trend inflation, such as the FRB Cleveland trimmed mean CPI, show a steady pickup.
Third, as a result, the scale of disinflation needed is now large. The following chart shows the annual core PCEPI inflation rate. We focus on the PCEPI both because it is the index that the Fed uses for its inflation target, and because it is measured more consistently over long periods of time than the CPI (see Bolhuis, Cramer and Summers (2022b)). We exclude volatile food and energy prices to get a better sense of the inflation trend. Using the core PCEPI measure, reaching the Fed’s 2% target will require a disinflation of about three percentage points.
Price index of personal consumption expenditures excluding food and energy (Percent change from a year ago), 1949-April 2022
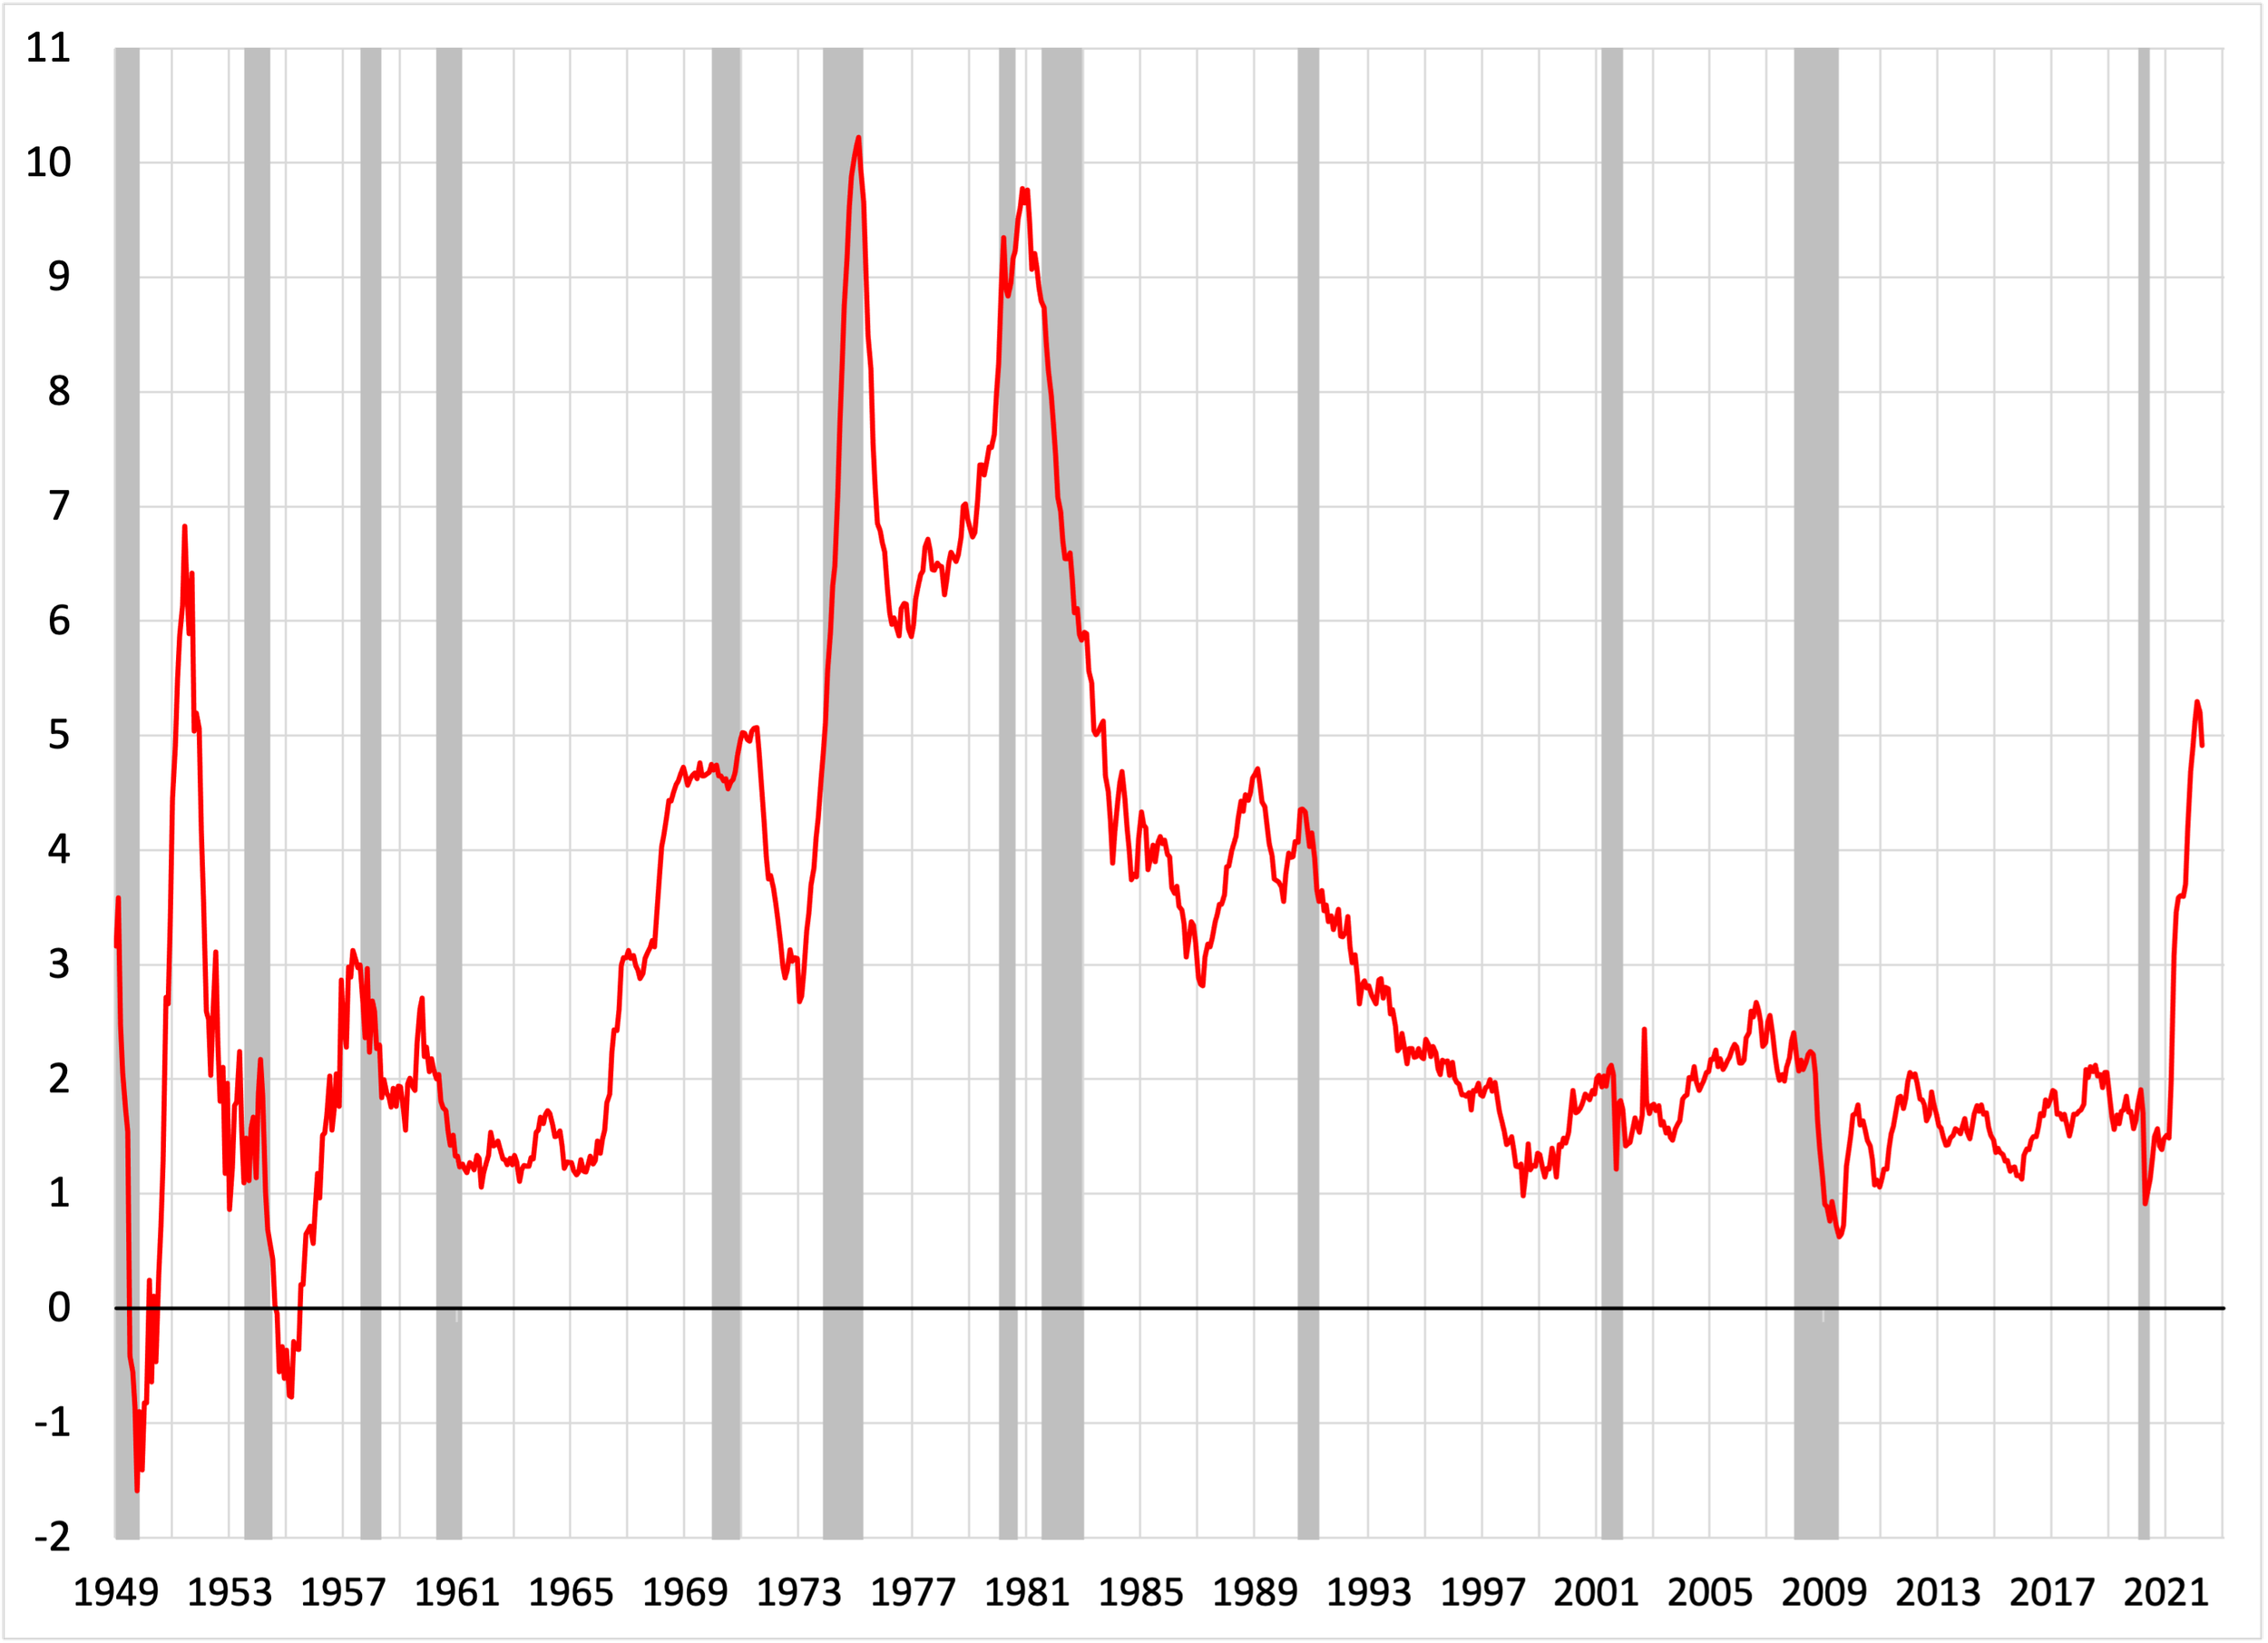
Notes: Core PCEPI inflation from 1960 uses the BEA price index of consumer expenditures excluding food and energy. We backcast core PCEPI inflation to 1949 by regressing the 1960-March 2022 sample on the adjusted core CPI from Bolhuis, Cramer and Summers (2022b). Gray shading denotes recessions.
To summarize the key features of past disinflations, we first look for significant inflation declines by examining the five-month centered moving average of the core PCEPI data plotted above. Starting in 1950, we identify 10 disinflations of at least 0.6 percentage points (see the table below). For these 10 episodes, the median disinflation is two percentage points, with a duration of 30 months. In only four cases in the past 70 years does inflation fall by three percentage points or more, the scale of disinflation that the FOMC currently seeks. Furthermore, these large disinflations typically lasted more than twice as long as the others (with a median duration of 59 vs. 25 months).
Disinflations since 1950 based on core PCEPI inflation

NR no recession. Notes: See chart above for core PCEPI inflation. The dating scheme follows two rules: (1) Each inflation peak is at least 0.6 percentage points above the previous trough; and (2) Each trough is at least 0.6 percentage points below the previous peak. The rise of the unemployment rate shows the change from the trough in the period six months before the recession that occurred during the disinflation to the peak during the six months after the recession. In one case (July 1971), the referenced recession ended eight months before the disinflation began.
Importantly, eight of the 10 post-1950 disinflations, including the four in which inflation fell by more than three percentage points, coincided with recessions. A ninth, the May 1971 disinflation, followed a recession by seven months. In the longest disinflation (starting January 1989), favorable supply conditions in the form of sustained productivity growth allowed the Fed to pursue “opportunistic disinflation” far beyond the recession that ended in March 1991.
As an indication of the economic sacrifice typically associated with disinflation, the table also shows the rise of the unemployment rate from just before to just after each associated recession. The median rise of the unemployment rate was 3.6 percentage points—both for the full sample and for the large disinflations. In theory, the sacrifice ratio—the rise of the unemployment rate for each unit of disinflation—varies inversely with the credibility of the Fed’s commitment to price stability, a point we emphasized in an earlier post. Nevertheless, it is worth keeping in mind that the median of the sacrifice ratios from each recession-associated disinflation is 1.2. That would be consistent with a 3.6-percentage-point rise of the unemployment rate for the three-percentage-point disinflation that the Fed currently seeks. Put differently, the history of past disinflations suggests that getting back to 2% inflation will be accompanied a rise in the unemployment rate (currently 3.6%) to around 7%!
We conclude by comparing the FOMC’s median policy rate projection with the path implied by a simple Taylor rule that uses the SEP core PCEPI median inflation projection. As we see in the following chart, the Committee’s projection remains well below what the Taylor rule implies until well into the projection period (shaded in gray). In the past, whenever the policy rate was substantially below the Taylor rule rate, as in the 1970s, inflation tended to rise, not fall. Put differently, the disinflation that the FOMC projects seems inconsistent with a simple Taylor rule.
Federal funds rate, Taylor Rule rate, and projected rule rates, quarterly, 1970-2024
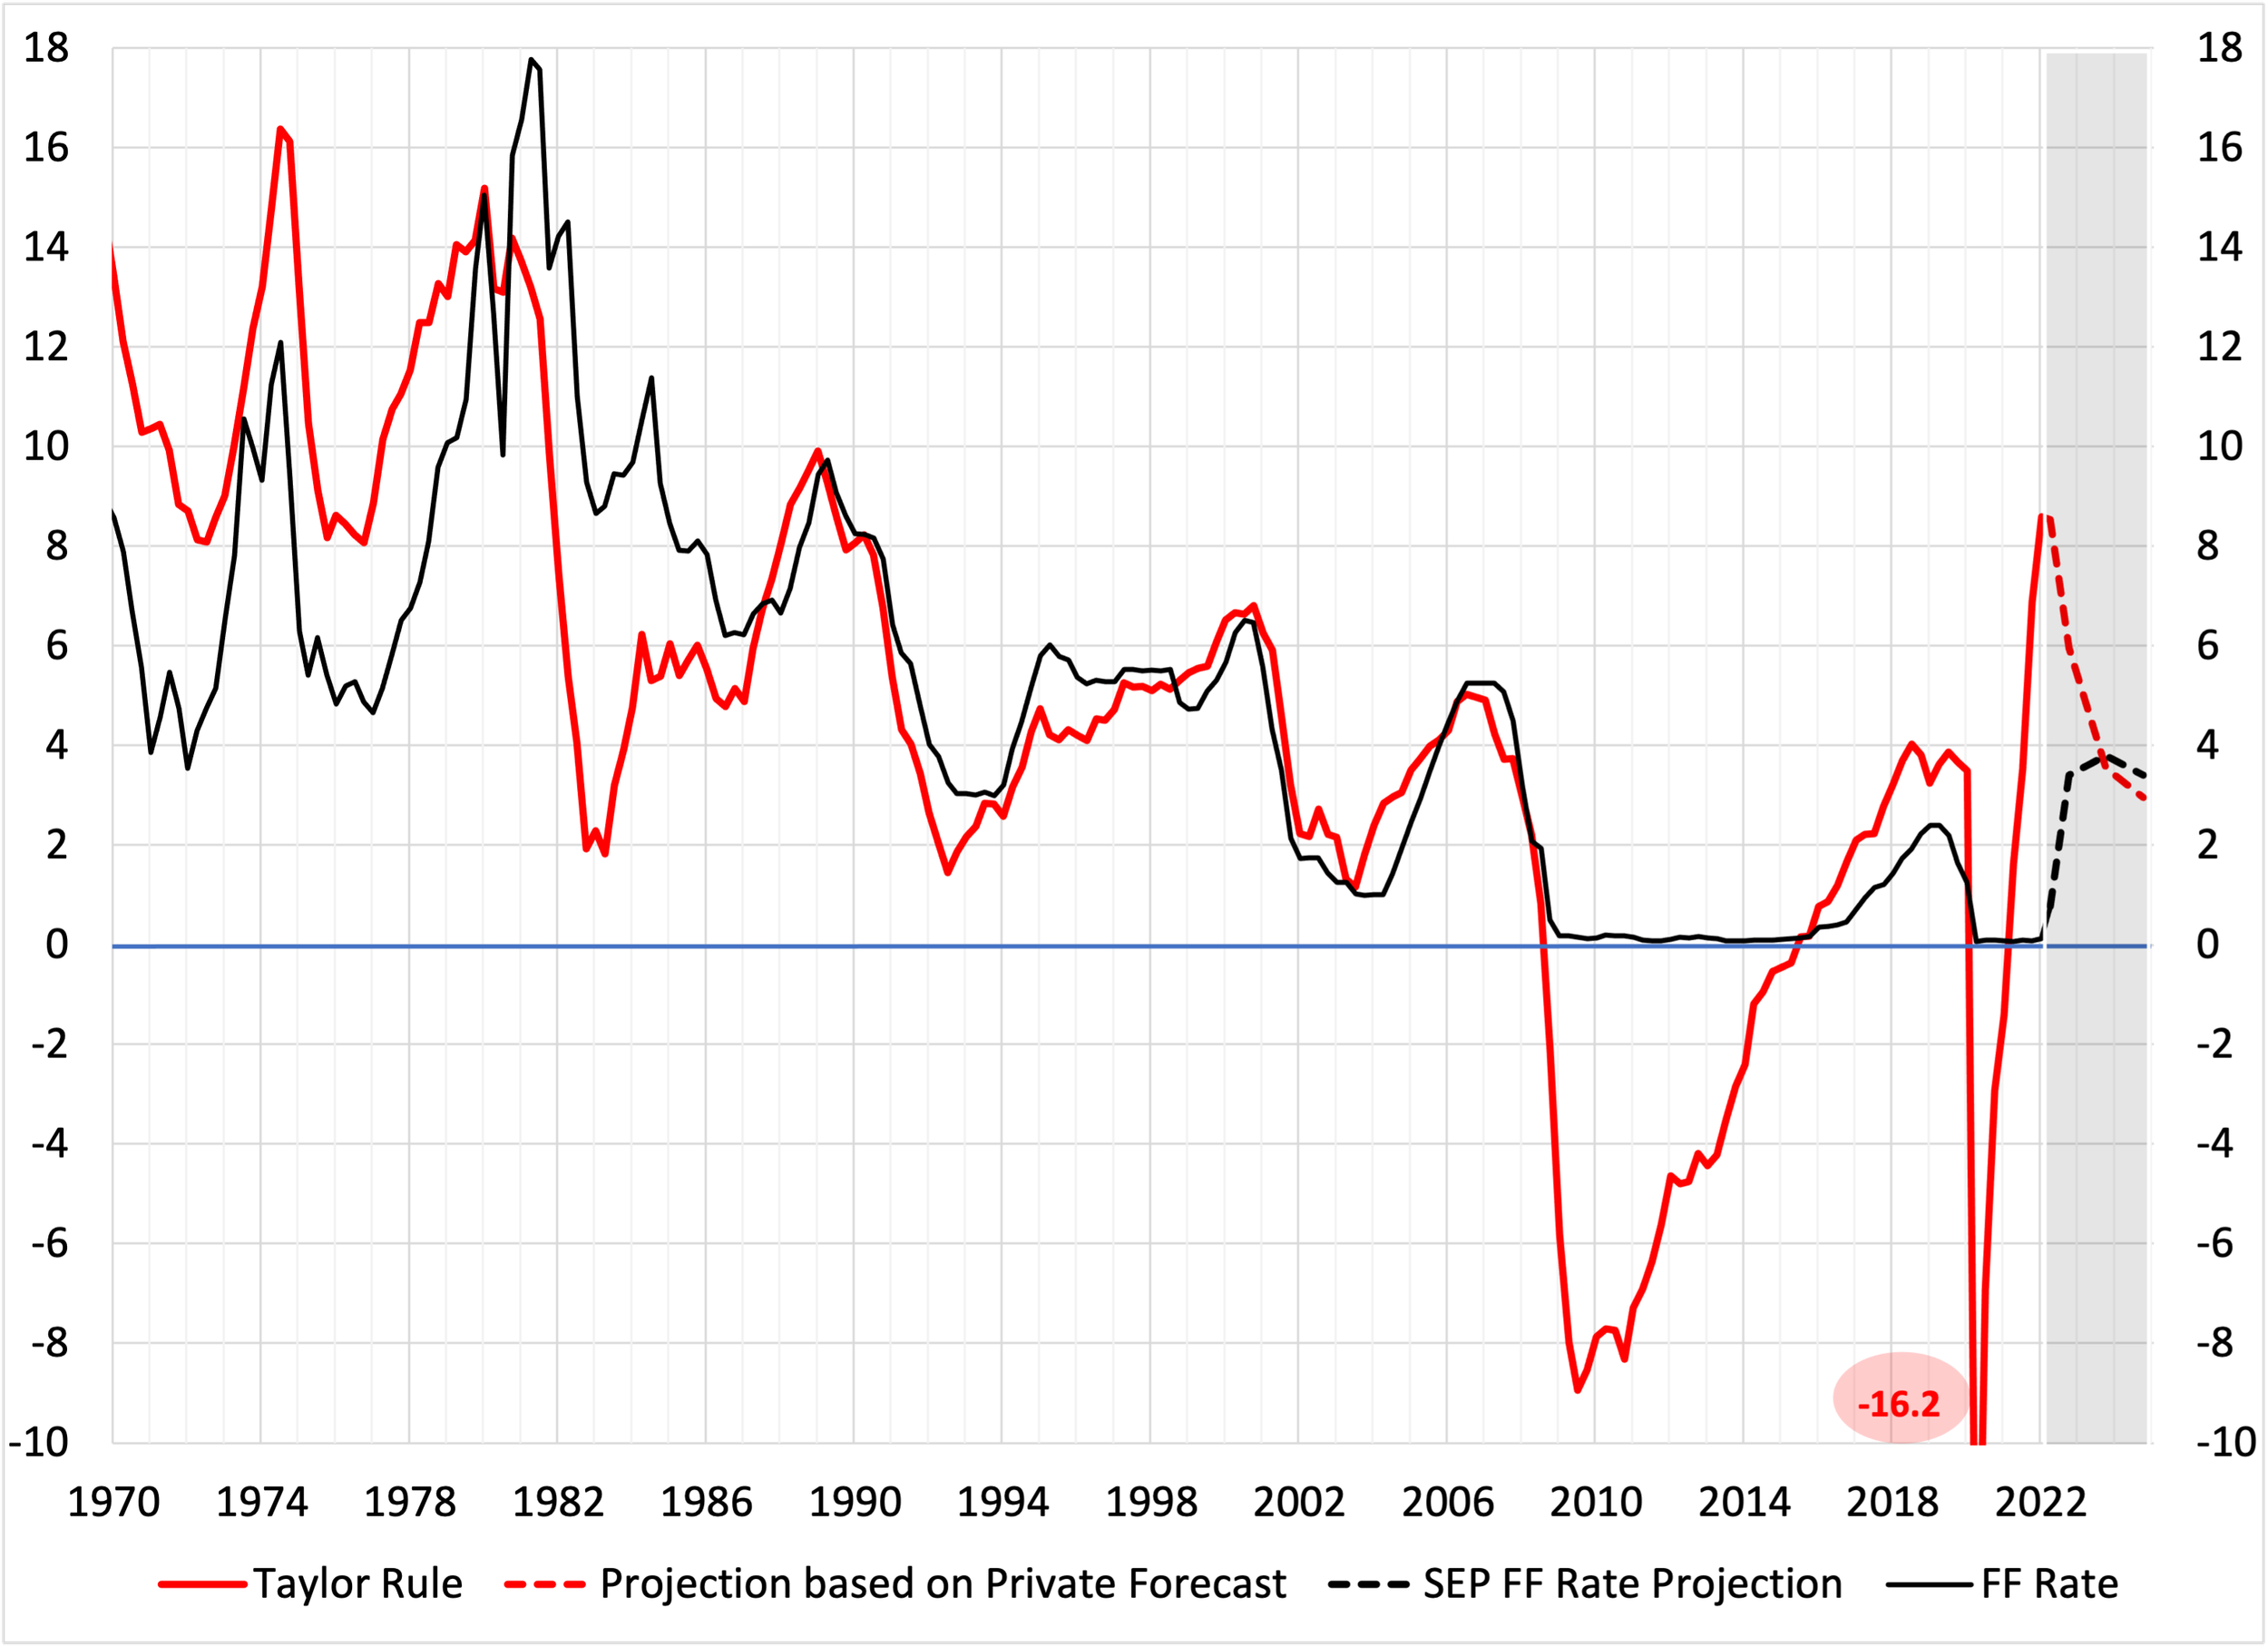
Notes: The Taylor rule (red) shown is the 1999 version that places twice the weight on resource utilization deviations compared to the original Taylor 1993 rule (see, for example, Yellen). To construct the rule rate, we use the real interest rate from Laubach and Williams, the core PCE price index (PCEPI), a target inflation of 2 percent, and the unemployment rate gap computed using the noncyclical rate of unemployment from the Congressional Budget Office. The SEP federal funds rate and core PCEPI projections are the median values from the FOMC’s June 2022 SEP.
Putting this all together, the key question is whether the Fed has a credible plan to restore price stability either within its two-and-one-half year projection horizon or over a longer, but clearly defined, period. A critical element in such a plan is an explanation of how the peak projected policy rate, as well as the growth and unemployment rate projections, are consistent with what was needed to restore price stability in past disinflations.
So, how high will rates have to go? In our view, if they raise interest rates as the FOMC projects (peaking at 3½% to 4%), inflation will not fall by three percentage points in the absence of a recession. Alternatively, raising rates substantially further—above 5%—by the end of 2023 makes a recession very likely. Of course, deteriorating financial conditions may generate a recession even with the interest rate path that the FOMC anticipates. That is, the recession-free disinflation story they are telling looks inconsistent and raises questions about their commitment to price stability.
Our hope is that, by the time the FOMC issues its next projections in September, policymakers will link their inflation policy narrative more closely to the experience of previous disinflations, making it both more realistic and more compelling. As we said at the outset, to retain credibility, policymakers will have to clarify their willingness to stay the course even if their disinflation policy induces a recession.