

“[T]he trigger for the acute phase of the financial crisis was the rapid unwinding of large amounts of short-term wholesale funding that had been made available to highly leveraged and/or maturity-transforming financial firms […]. Then-Federal Reserve Vice Chair Janet Yellen, Speech, June 2, 2013.
Double-entry bookkeeping is an extremely powerful concept. Dating at least from the 13th century (or possibly much earlier), it is the idea that any increase or decrease on one side of an entity’s balance sheet has an equal and opposite impact on the other side of the balance sheet. Put differently, whenever an asset increases, either another asset must decrease, or the sum of liabilities plus net worth must increase by the same amount.
In this post, we provide a primer on the nature and usefulness of private sector balance sheets: those of households, nonfinancial firms, and financial intermediaries. As we will see, a balance sheet provides extremely important and useful information. First, it gives us a measure of net worth that determines whether an entity is solvent and quantifies how far it is from bankruptcy. This tells us whether an indebted firm or household is likely to default on its obligations. Second, the structure of assets and liabilities helps us to assess an entity’s ability to meet a lender’s immediate demand for the return of funds. For example, how resilient is a bank to deposit withdrawals?
After discussing how balance sheets work, we show how to apply the lessons to the November 2007 balance sheet of Lehman Brothers—nearly a year before its collapse on September 15, 2008.
Before getting to the details, it is important to distinguish a balance sheet from an income (or profit and loss) statement. The first is a picture of an entity’s overall financial health, showing what it owns and owes. In contrast, the second tells us about the flow of revenue and expenditure, providing information about current income net of payments, or profitability. These two accounting statements are closely linked, as net income or profit will accumulate on the balance sheet, adding to (or subtracting from) assets and net worth.
We now start with the fundamental balance sheet identity:
Assets = Liabilities + Net Worth
That is, assets always equal the sum of liabilities and net worth. Writing it this way emphasizes that, like borrowings and other liabilities, net worth is a source of funds used to finance assets. We can also think of net worth as the residual that would be left over if an entity were to sell everything it owns and pay off all its debts.
A few examples reveal the usefulness of this key accounting relationship. Starting with individuals, the following table reports the balance sheet for all U.S. households at the end of 2021, with assets on the left and liabilities plus net worth on the right. Starting on the left, household assets are grouped into two broad categories. First, there are the nonfinancial, or “real” assets. Dominated by real estate—houses and the land on which they are built—this category includes automobiles, furniture, household appliances, and the like. Together, these account for 30% of household assets. Individuals also own substantial financial assets in the form of accounts at banks, individual stocks and bonds, mutual funds, and claims on pension funds. In total, these make up the remaining 70% household’s assets. Adding everything up, the total value of household assets is the United States is just shy of $170 trillion—or about 7 times nominal GDP.
Turning to liabilities plus net worth on the right-hand side of the table, note that the bulk of what households owe is in the form of mortgages and various types of consumer credit. While many people feel burdened by debt, overall individuals have relatively modest liabilities, totaling just over $18 trillion. As a result, net worth (assets minus liabilities) is $150 trillion. Importantly, this wealth is highly concentrated, with the top 10% (ranked by wealth) having a net worth equal to 70% of the total.
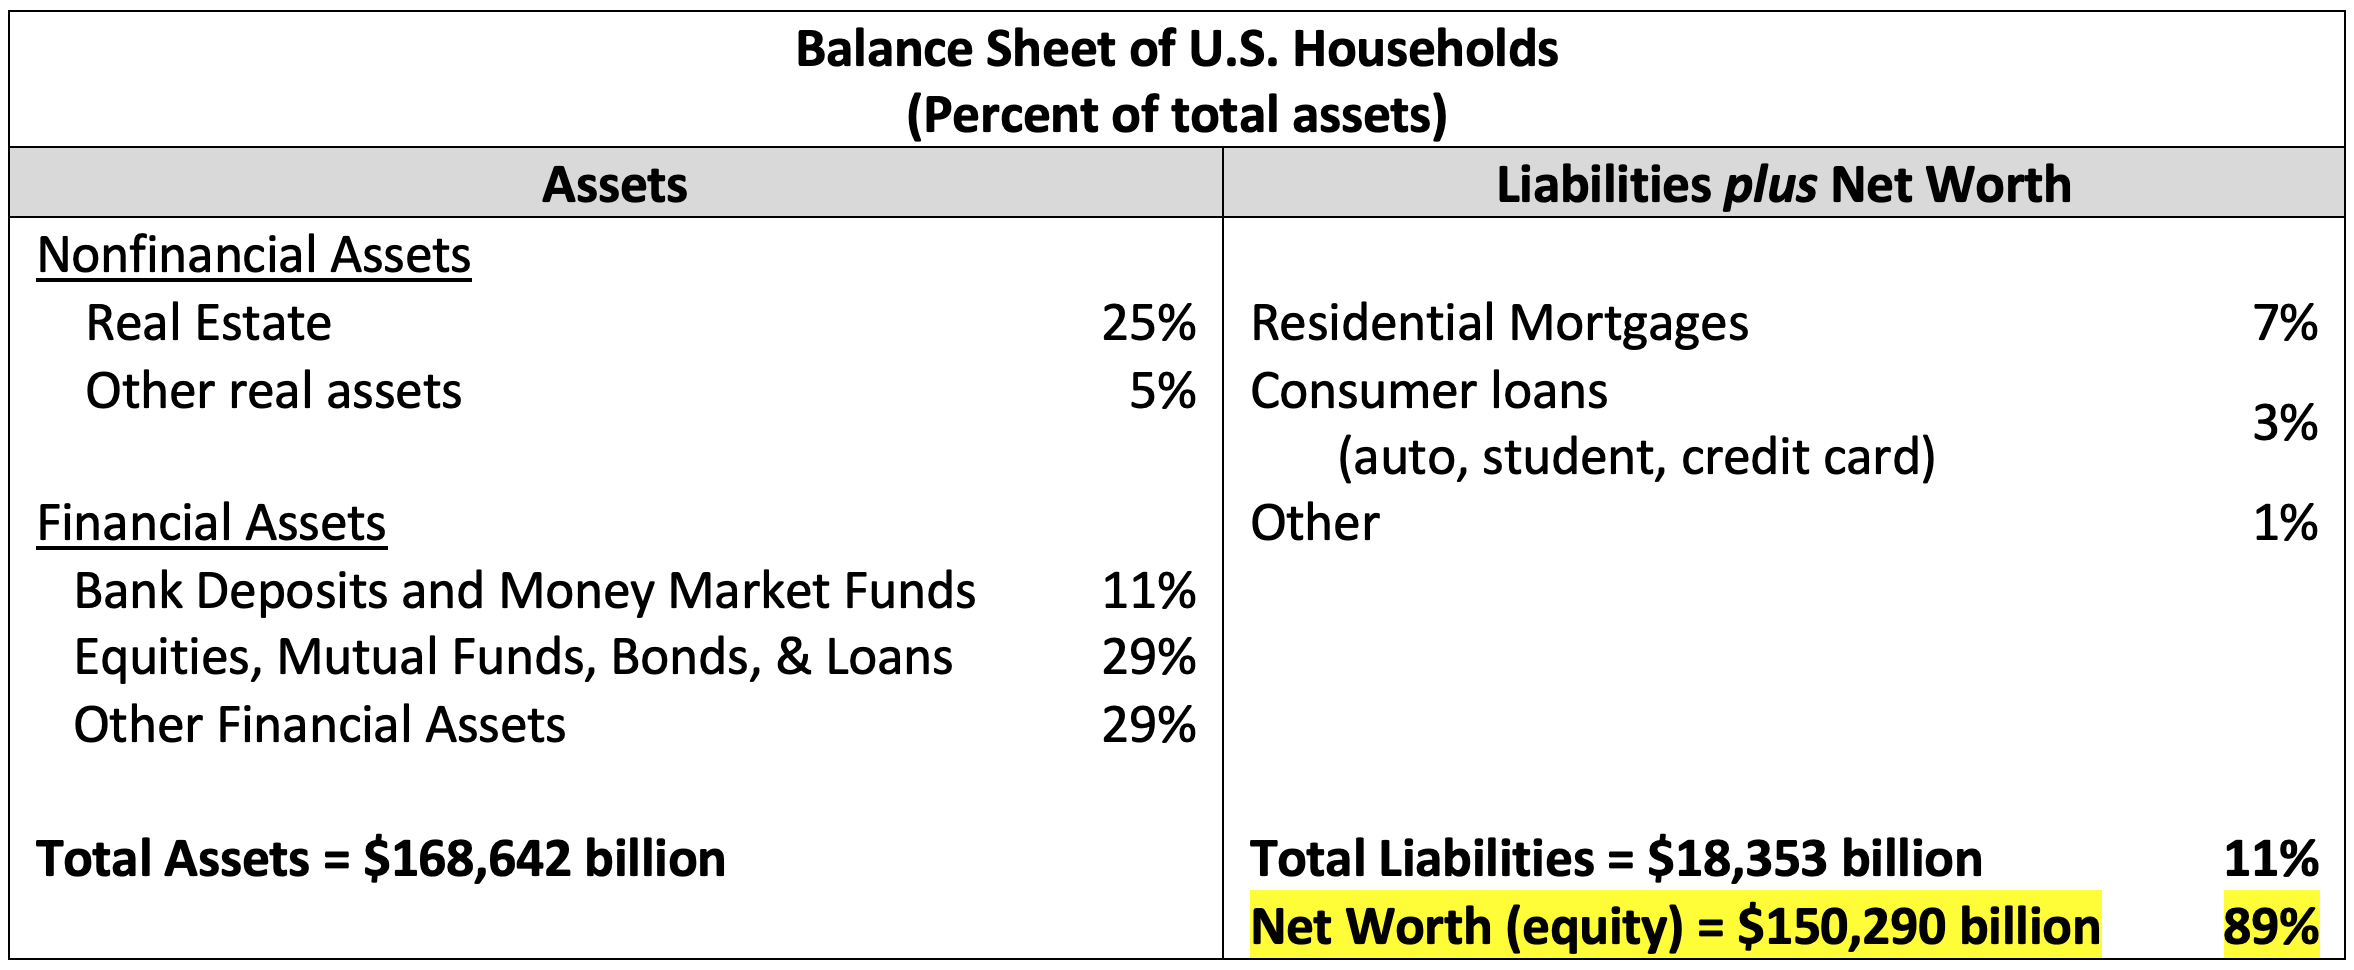
Source: Table B.101 of the Financial Accounts of the United States, Federal Reserve Board Release Z.1, fourth quarter 2021.
Before proceeding to the business and financial sectors, it is worth emphasizing the mechanics of a household balance sheet. For this purpose, we use four simple examples. In the first, someone sells some of their mutual fund investments to pay down their outstanding mortgage balance. If a person does this in the amount of $100,000, it will reduce the “Equities, Mutual Funds, Bonds, & Loans” by $100,000 and reduce the “Residential Mortgages” by $100,000. That is, there is an equal reduction in assets and liabilities, with no change in net worth.
Next, consider the case where someone exchanges (trades in) their old car worth $10,000 for a new one that costs $40,000. If the buyer purchases the car by using $5,000 in cash and getting a $25,000 auto loan, there are three changes in the balance sheet. Bank deposits decrease by $5,000, consumer loans increase by $25,000 and other real assets rise by $30,000 (the net value of the new car after trading in the old car).
In these first two examples, assets and liabilities both change by equal amounts. A third possibility is that someone chooses to sell an equity investment and deposit the proceeds into their bank account. Here, one item on the asset side of the balance sheet decreases (equities) and another item increases by an equal amount (bank deposits). There would be no change in any of the items on the right side of the balance sheet.
Finally, consider a case in which equity market prices rise, increasing the value of the household’s financial assets. Assuming the owner makes no transactions, the recorded rise in assets shows up on the on the right side of the balance sheet as an increase in net worth.
The principle behind these examples is that when one part of a balance sheet changes, something else must change as well. An increase of an item on one side of the balance sheet must be accompanied either by an increase the other side, or by the decrease of a different item on the same side. Again, if the amount of one asset rises, one of three things must happen: the quantity of another asset could decline, the size of a liability might rise, or net worth could increase. Regardless, the balance sheet identity must be maintained: the sum of the value of assets must equal total liabilities plus net worth.
Before continuing, note that the ratio of total assets to net worth on the household balance sheet—a measure known as the gearing ratio—is an extremely modest 1.12. However, since net worth is highly concentrated among the wealthy, the gearing ratio for the bottom 50% of households is 2.51, more than double the overall average. (We use the term gearing ratio to distinguish it from leverage ratio, which refers to the ratio—usually expressed in percent—of net worth to assets. The leverage ratio is the reciprocal, or inverse, of the gearing ratio.)
The gearing ratio is a measure of leverage—an extremely important concept, as it magnifies both risk and return. To see how, consider a simple one-year investment in a stock whose price either rises or falls 10% over the course of the year. If someone were to invest $100 of their own funds in that stock, at the end of the year they would have $110 or $90. Now consider taking the initial $100 and borrowing another $100, using the combined total to purchase double the amount of the same stock. Initially, the investor has total assets of $200, a loan of $100 and net worth of $100. At the end of the year, this $200 investment is worth either $220 or $180. After repaying the loan, the investor is left with either $120 or $80—a 20% gain or loss. With a gearing ratio of 2, the investor either had double the gain or double the loss they would have had with a gearing ratio of 1. Also, note that, if the investor had borrowed $1,900, for a gearing ratio of 20, the 10% loss would have more than wiped out the entire original investment and led to a default on the loan. Leverage magnifies gains and losses, increasing the likelihood of default.
Moving on, we can contrast the balance sheet of U.S. households with that of nonfinancial firms and depository banks. Starting with the first, we combine corporate and noncorporate balance sheets to obtain the information in the following table. Again, real estate accounts for a substantial fraction of assets. Compared to households, other real assets, including equipment, inventories, and intellectual property, are quite important for firms. The residual category of other financial assets includes things like corporate equities of other firms and investments abroad. On the liabilities side, firms issue debt securities in the form of bonds and commercial paper, and they borrow from financial intermediaries (both banks and nonbanks). Other liabilities include trade credit, taxes owed, and a large volume of unspecified miscellaneous liabilities.
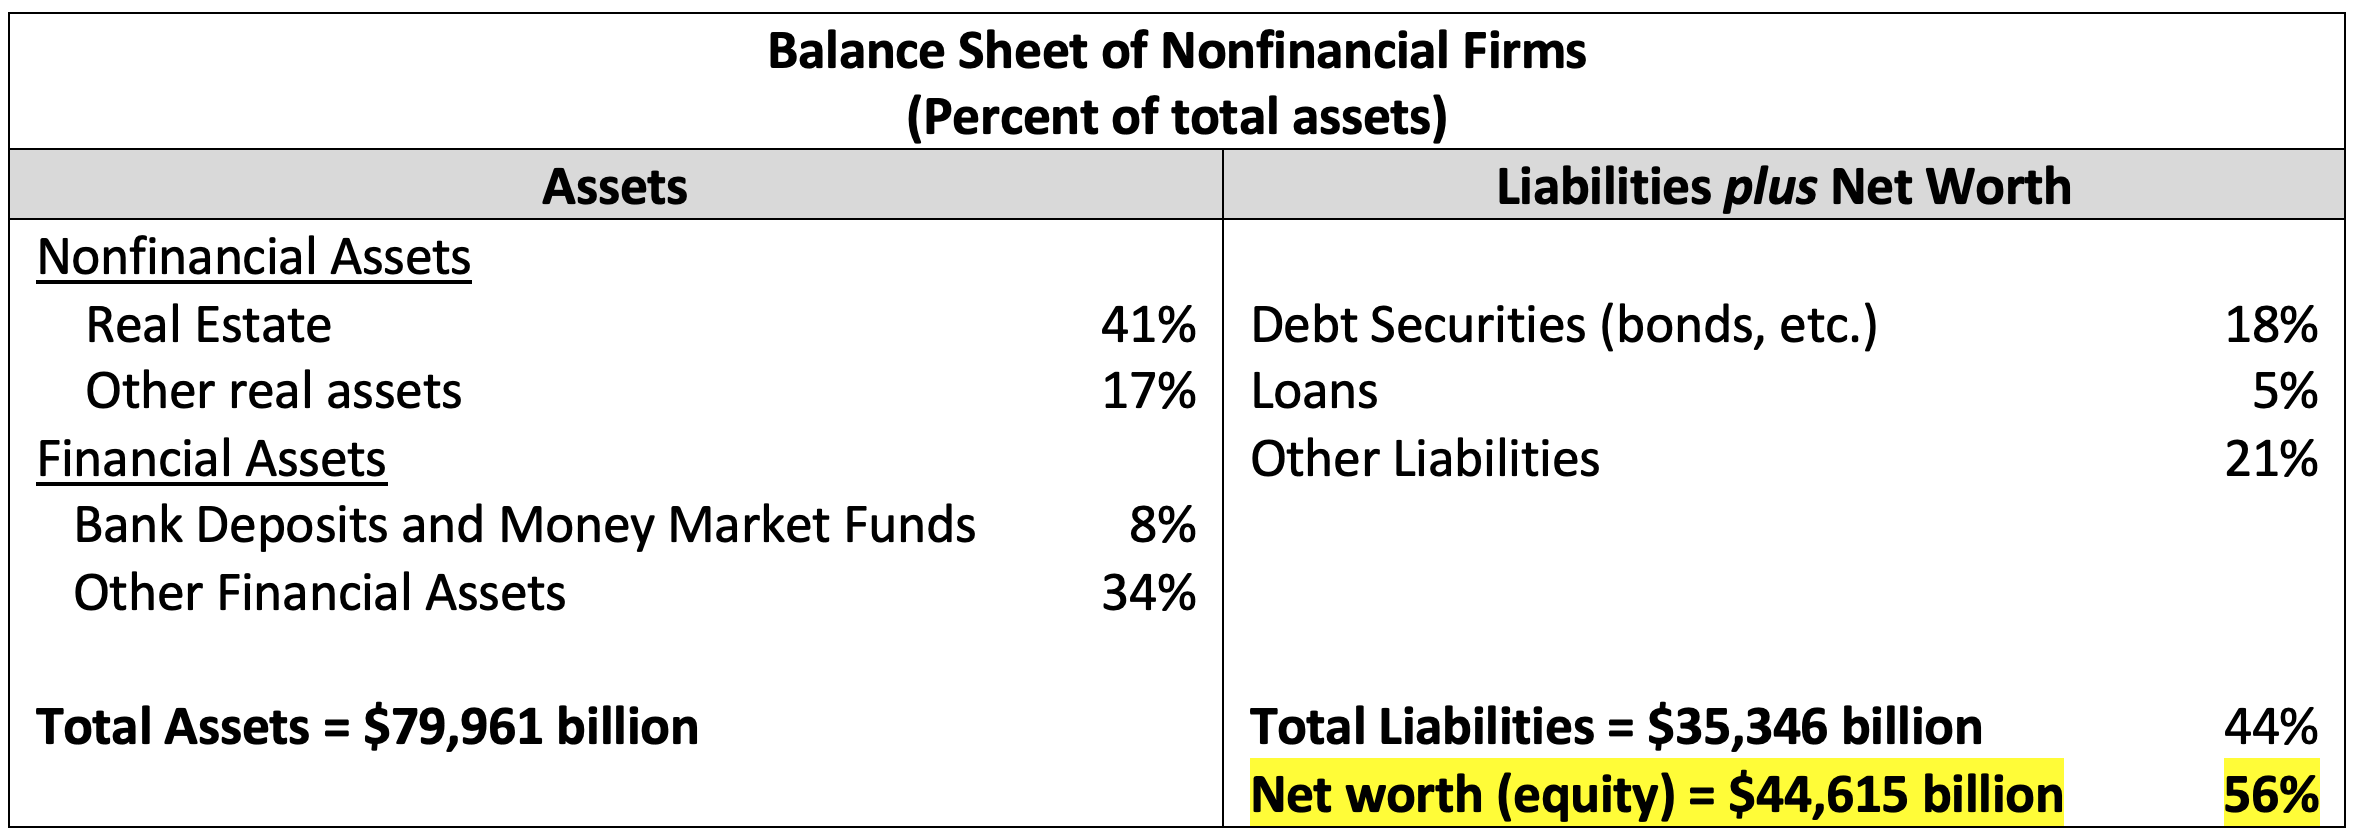
Source: Sum of entries in Tables B.103 and B.104 of the Financial Accounts of the United States, Federal Reserve Board Release Z.1, fourth quarter 2021.
Comparing nonfinancial firms to households, notice that assets are less than half the size—$80 trillion vs. $170 trillion. Furthermore, liabilities are nearly twice as large—$35 trillion vs. $18 trillion. Consequently, the gearing ratio (assets divided by net worth) is substantially higher, 1.79 as opposed to 1.12. (We note that a different source of balance sheet information—Table 2.1 in the IRS tax statistics—puts U.S. corporate gearing at 2.4 in 2018).
Finally, in the following table, we turn to the balance sheet of U.S. banks. Notably, bank liabilities are primarily deposits, while assets are spread among loans, securities and cash. Importantly, net worth is less than 10% of total assets, so the gearing ratio is 11.49. Since the role of a financial intermediary is to channel funds from savers (depositors) to users of funds (loans), this makes some sense, but the high gearing ratio means that it is risky. (Banks’ net worth is usually referred to as capital. See our discussion here.)
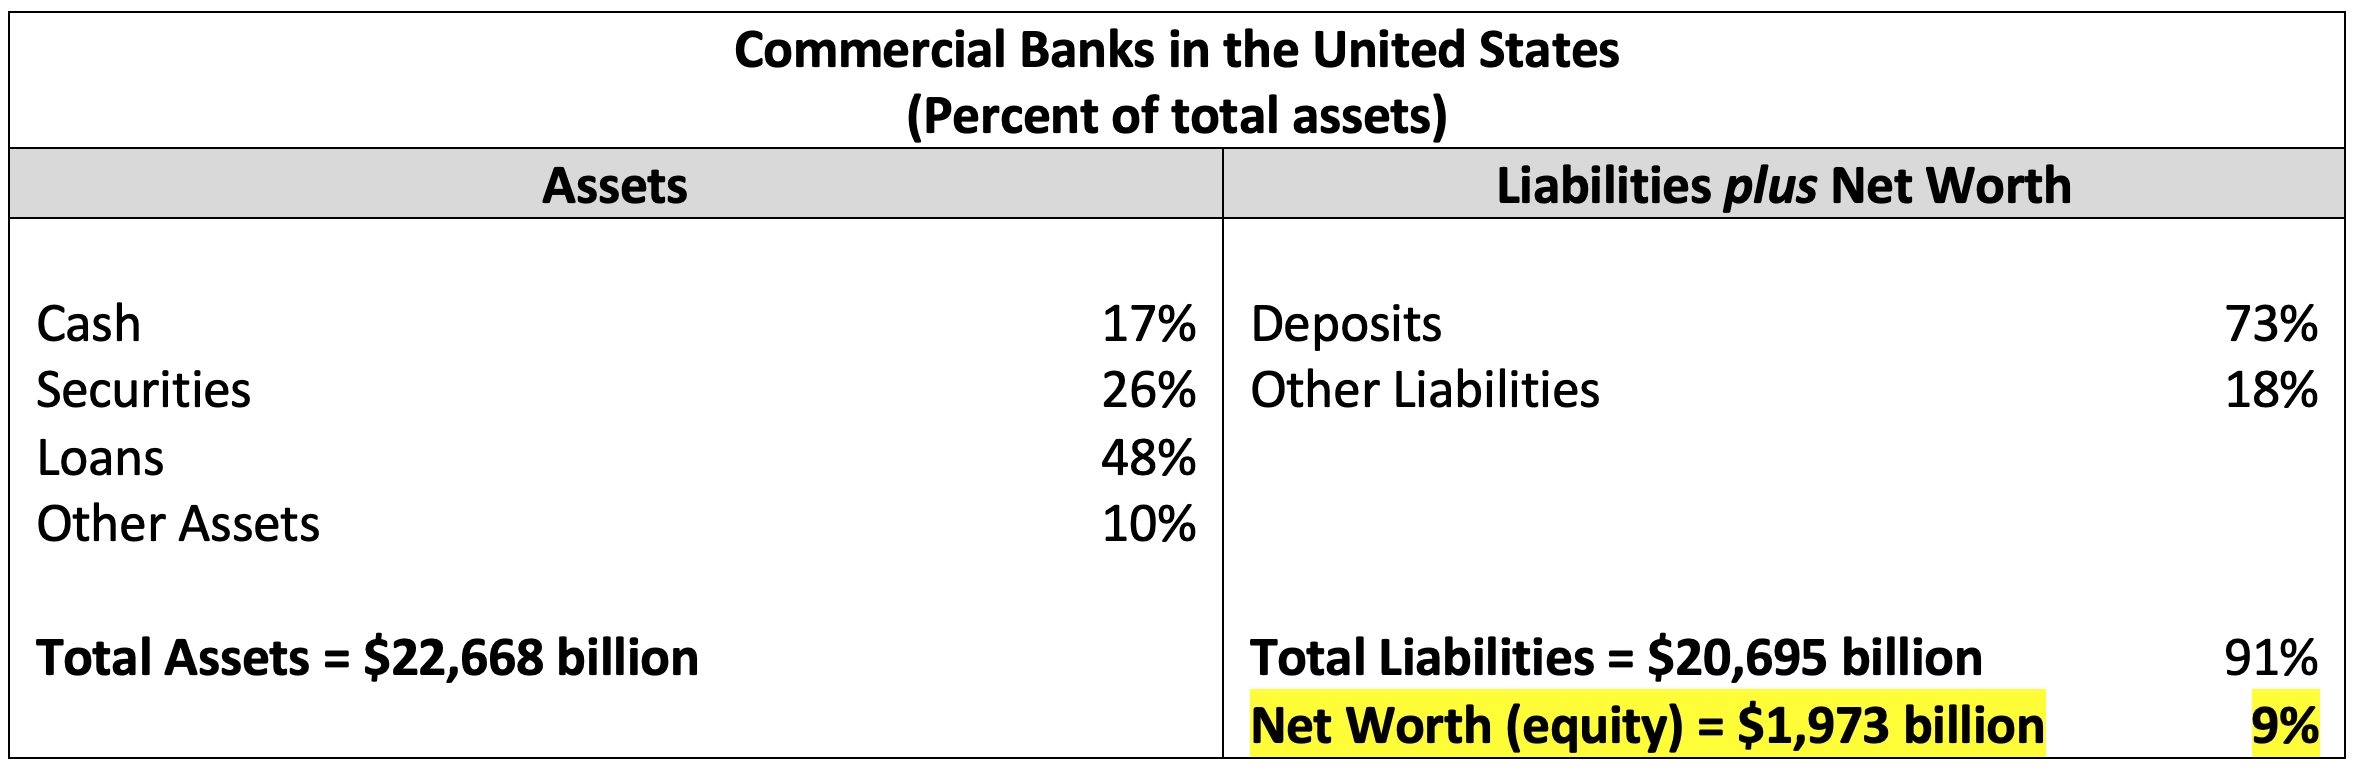
Note: The table excludes nonfinancial assets, which tend to be small. For example, for JP Morgan Chase, in 2021, property, plant and equipment accounted for less than 1% of total assets.
Source: Table 2 of Federal Reserve Release H.8, March 2022.
Looking at the balance sheet of the banking system reveals not only the relatively low net worth, but also the fact that banks engage in a combination of credit, maturity, and liquidity transformation. That is, their assets are subject to greater default risk, longer term, and less liquid than their liabilities. (For this purpose, we define liquidity as the ease with which an asset can be sold immediately for cash without sacrifice of value.)
To see the various transformations that banks undertake, note that deposits account for the lion’s share of their funding—73% of the total. These liabilities are promises to pay fixed dollar amounts on demand (or at a designated time). That is, from the perspective of the depositor, these are highly liquid and bear no (or relatively little) default risk. In contrast, with the exception of cash assets—typically reserves held at the central bank—a bank’s assets can fluctuate significantly in value, have maturities that may extend several years, and (aside from Treasury securities) are difficult, if not impossible, to sell quickly for cash without significant loss of value. In practice, bank balance sheets do not provide full details on the creditworthiness, maturity or liquidity of their assets and liabilities. But market analysts try to estimate these factors in assessing a bank’s well-being, while bank managers and their supervisors have private information that allow them to make more accurate estimates.
The greater the balance sheet mismatch—the extent of credit, maturity and liquidity transformation—the more that a bank will be prone to a run. Should a bank’s depositors lose faith in its ability to make good on the promise to redeem deposits for cash, they may all try to withdraw at the same time. The government safety net, in the form of deposit insurance and the central bank lender of last resort, is designed to eliminate these runs. But, as we discuss in an earlier post, it is essential that central banks ensure a commercial bank is solvent before making a loan. Given the relatively low net worth of most banks, this may not always be the case.
This brings us to Lehman Brothers and the financial crisis. The following table shows Lehman’s balance sheet nearly a full year before its September 2008 collapse. Importantly, only 3% of assets are funded by equity. That is, the gearing ratio is over 30! This means that even a modest adverse shock to the value of its assets could drive Lehman bankrupt. Second, Lehman relied on short-term debt and collateralized borrowing (primarily short-term repurchase agreements) for nearly half of its financing. Third, because Lehman was a nonbank, its liabilities were not insured, and it did not have routine access to central bank lending facilities. Consequently, its reliance on short-term funding suggests an extreme maturity mismatch that invites creditors to run as soon as their confidence erodes. The resulting loss of short-term funding would force the firm to sell assets quickly at a loss. As then-Fed-Vice Chair Yellen states in the opening quote, this is exactly what happened at the peak of the 2008 crisis.

Source: Figure 5, Morris and Shin (2008).
Because Lehman Brothers published this balance sheet in early 2008, everyone could see even at a relatively early stage in the crisis the fragility inherent in its extreme leverage and liquidity transformation. Yet, Lehman continued operating until it failed catastrophically, seeding distrust throughout the financial system and fueling the largest financial crisis since the Great Depression. The regulatory reforms since 2010, including more robust capital and liquidity requirements, complemented by stress tests, are designed to prevent intermediaries from having balance sheets that look like Lehman’s. (See our earlier posts here, here, and here.)
Our primary message is that balance sheets provide very useful information. Whether it is a household, a nonfinancial firm, or a financial intermediary, the structure of assets and liabilities can tell us both what an entity is doing and whether it will be resilient to adverse shocks. For U.S. households and nonfinancial firms, today’s average balance sheet looks reasonably resilient. Nevertheless, there are many households and businesses whose high levels of debt and small amounts of cash and net worth makes them fragile.
Banks (and nonbanks like money market mutual funds that perform bank-like services) are another story. Here, average net worth is low, and liquidity transformation is substantial, so they are vulnerable, and require a government safety net and (as a result) extensive regulation and supervision.