

“There is a lesson from the experience of the 1970s, which is [that the] difference between higher and lower unemployment is 2 or 3 percent of the people being unemployed. The difference between higher and lower inflation is 100% of the people feeling they’re being robbed of purchasing power by higher prices.” Former Treasury Secretary Lawrence Summers, CNN, November 14, 2021.
“Headline” inflation is making painful headlines again. In October, consumer prices rose by 6.2 percent from a year ago—the most rapid gain in at least three decades. Measures of trend inflation also are showing unsettling increases, with the trimmed mean CPI up by 4%. And there are reasons to believe that inflation will stay well above policymakers’ 2% target for an extended period. For example, job opening and quit rates point to accelerating wages, while owner equivalent rent—a leader of the trend in prices—rose by more than 4% at an annual rate over the past six months.
In this post, we briefly summarize how we got here and argue that the Federal Reserve needs to change course now. In our view, current monetary policy is far too accommodative. Moreover, the sooner the Fed acts, the more likely it is that policymakers will be able to restore price stability without undermining the post-COVID expansion.
Taking a step back, beyond monetary expansion, we see multiple factors driving inflation up to what most would agree are unacceptably high levels. These include:
Discretionary fiscal expansion that added at least two percentage points to growth over the past year (see here).
Unprecedented, pandemic-related shifts in the composition of demand that have boosted goods consumption roughly 10% above its pre-pandemic trend, while services consumption languishes 5% below its trend.
Firms’ need to counter inventory shortfalls and build buffers against previously unanticipated supply chain risks.
Changing attitudes among older workers that is contributing to the post-COVID plunge in the labor force participation rate.
Pandemic-induced increases in the cost of supplying in-person services.
Bottlenecks in the supply of raw material and intermediate inputs, as well as transportation delays (see here).
The reallocation of capital and resources resulting from the shift to remote work.
While the first three factors increase demand, the others reduce supply (at least temporarily) and raise production costs. Except for the fiscal impulse (which turns contractionary next year), all seem likely to persist well into 2022. As a result, it is reasonable to expect that inflation will be stuck around its 4% trend (or possibly higher) for some time.
So, what should the Federal Open Market Committee (FOMC) do? Looking back, recall that immediately prior to the onset of the pandemic, the Fed held assets valued at just over $4 trillion. Today, the total is $8.6 trillion, and purchases of securities are scheduled to continue into next year. Furthermore, since mid-March 2020, the federal funds rate target range has been 0 to 0.25%. These expansionary policies promote loose financial conditions—including elevated equity and housing prices—that continue to stimulate aggregate demand.
To assess how easy current interest policy is, we compare it to what the Fed calls the “balanced approach (shortfalls)” rule, a version of a Taylor rule that—until recently—has called for an accommodative policy stance during the pandemic (see Figure B on page 45 of the latest Monetary Policy Report). According to this benchmark, the target policy rate is set equal to the sum of the equilibrium real rate (r*), inflation, one-half the deviation of inflation (p) from the 2% longer-term objective (p*), and twice the lesser of the deviation of the longer-run expected rate of unemployment (u*) from the current unemployment rate (u) and zero.
The following chart plots the gap between the rate implied by the balanced approach rule and the current policy rate (the orange line) together with inflation measured by the four-quarter percent change in the personal consumption expenditures price index excluding food and energy (the black line). Negative values of the gap indicate that policy is tighter than the rule implies, while positive values signify policy is more accommodative. (The dashed portion of the orange line identifies periods when the rule implies a negative policy rate.)
Deviations of the Federal Reserve policy rate from a simple policy rule and core inflation (annual rate, quarterly) 1961-2021
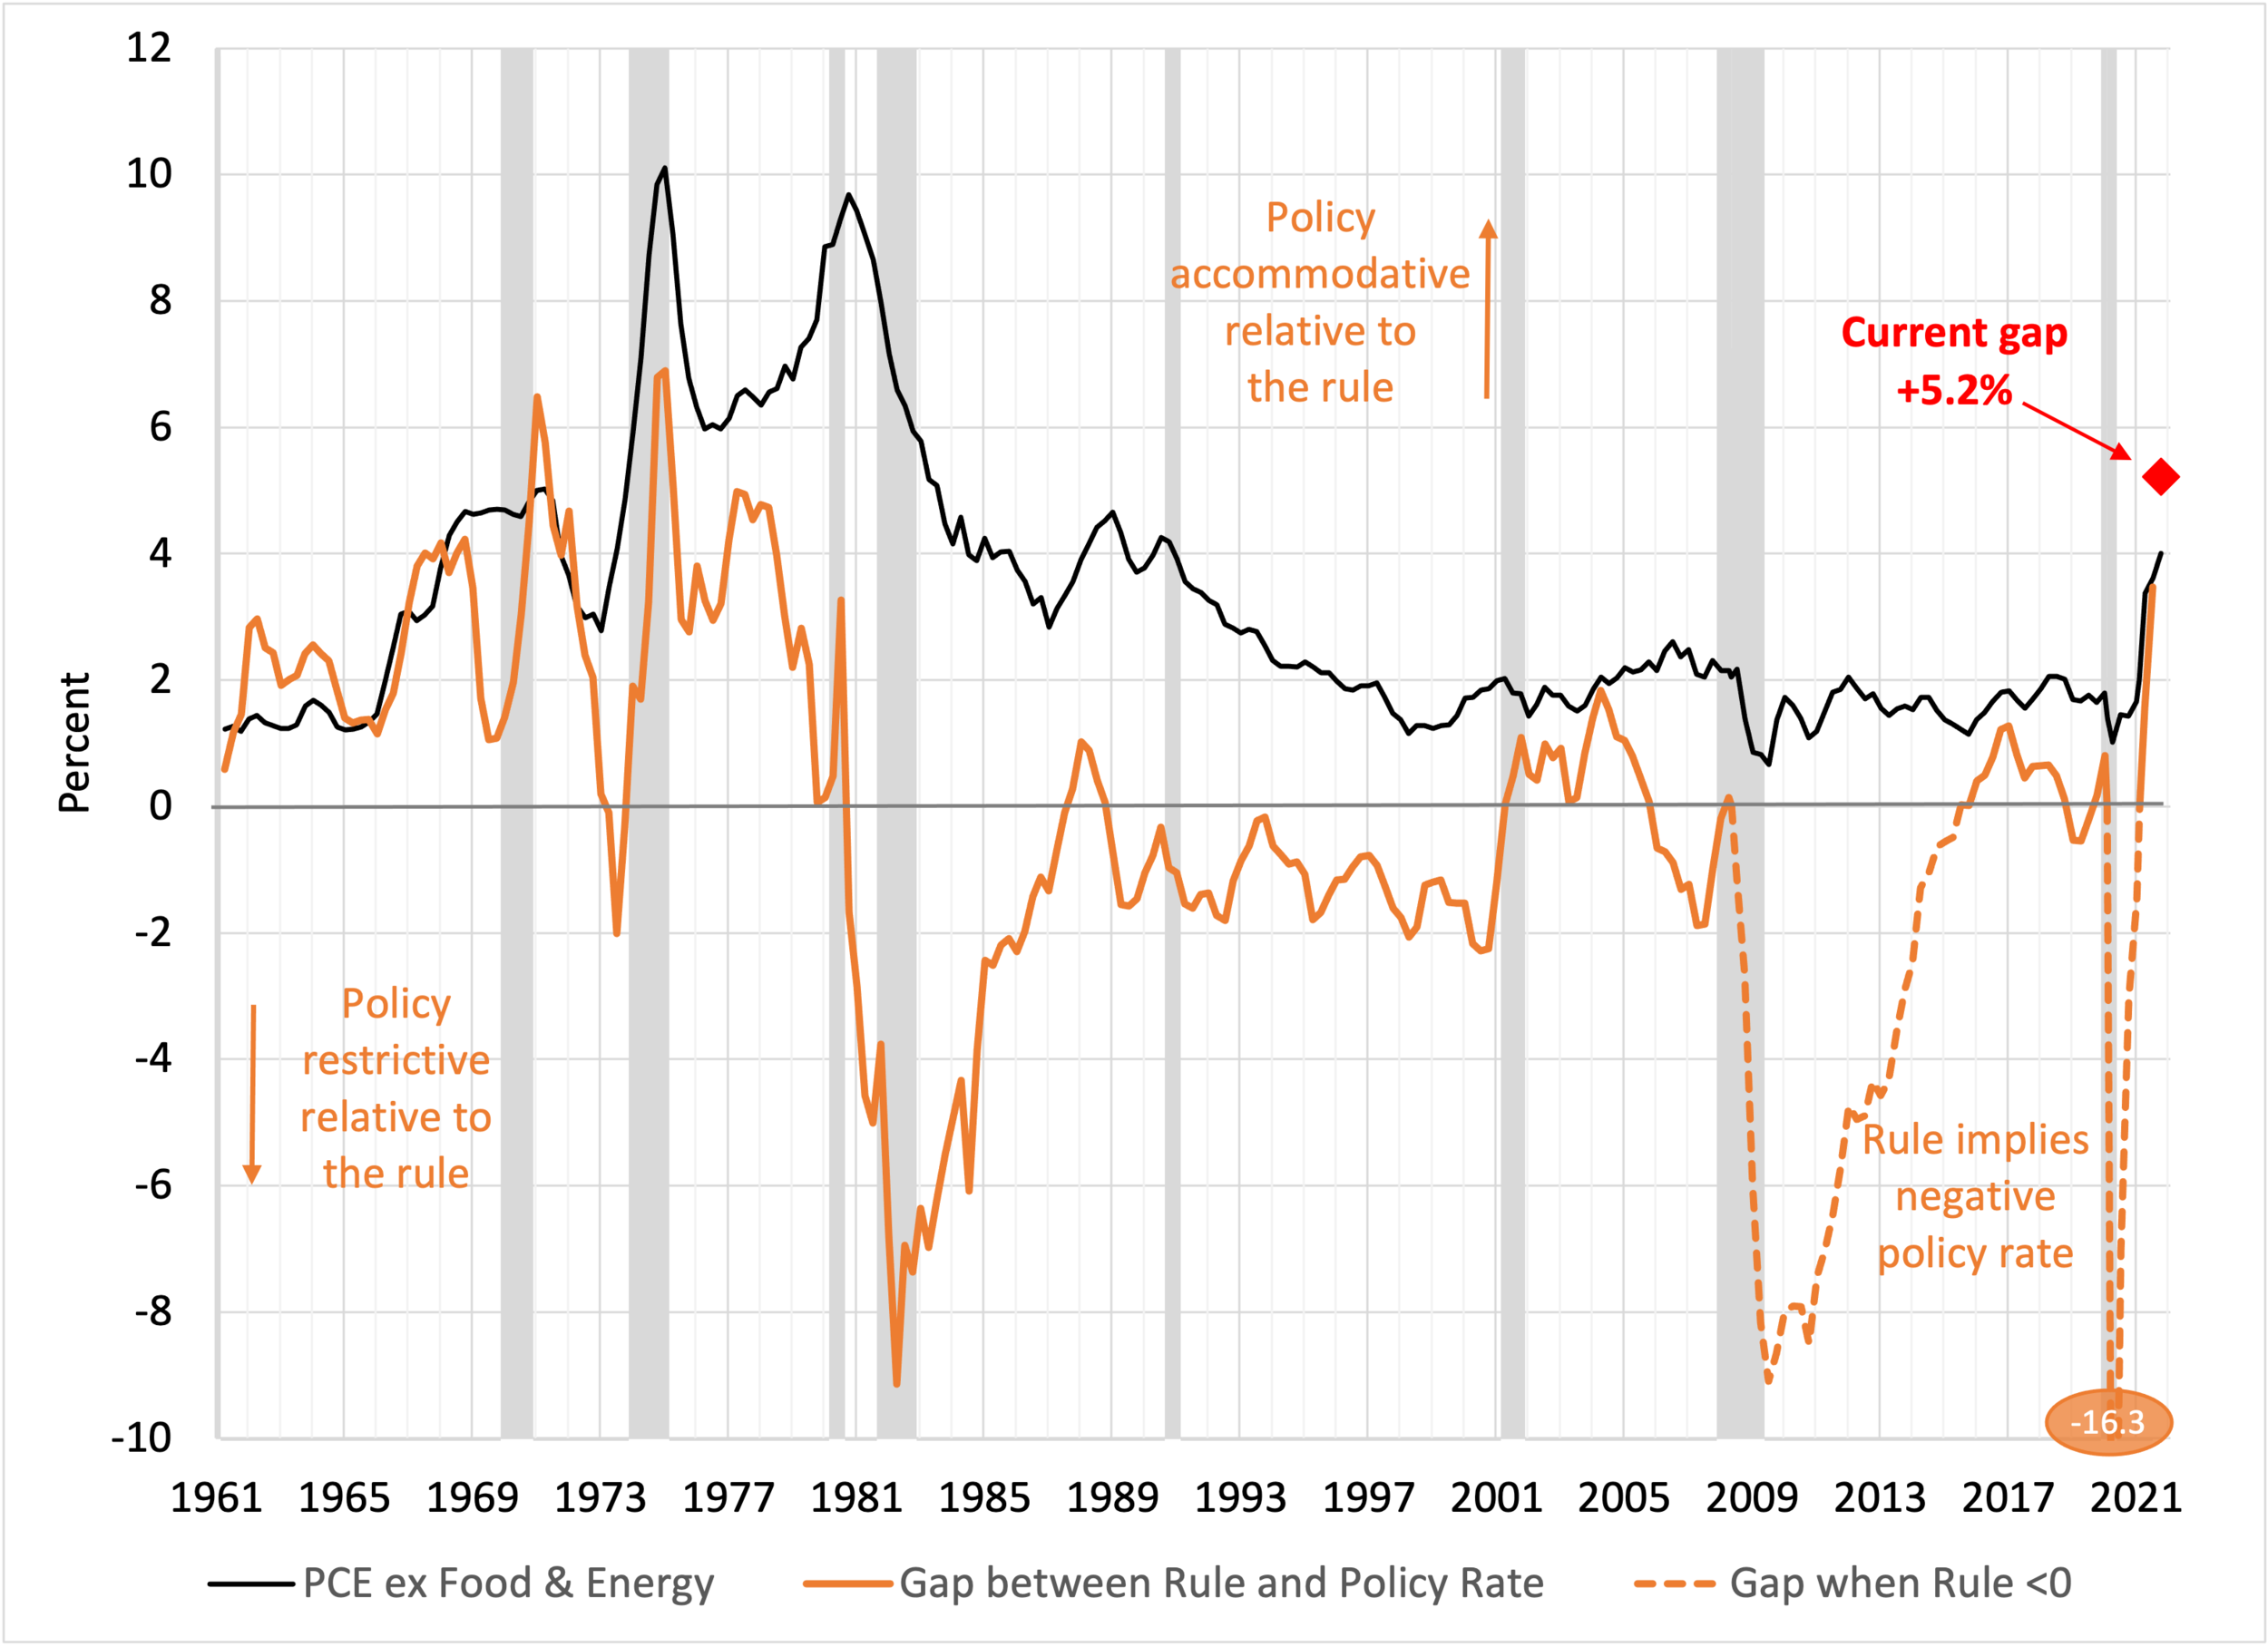
Note: The orange line is the rate implied by the balanced approach rule minus the effective federal funds rate. The rule is computed using Laubach and Williams two-sided estimates of r* and the Congressional Budget Office estimates of the noncyclical rate of unemployment (u*).
Source: Federal Reserve Bank of New York, FRED, and authors’ calculations.
Looking at the chart, two things stand out. First, when inflation was high and rising during the late-1960s and 1970s, policy was generally accommodative compared to the rule: that is, the orange line was typically above zero. By contrast, in the 1980s and 1990s, a period when policy was restrictive (with the orange line below zero), inflation was falling. Second, the current policy rule gap (red diamond) is not only positive but higher than any observation since 1975 and all but 4 quarters in the past 60 years!
To be clear, we are not suggesting policymakers act in a way that automatically conforms to the numbers in this chart. Indeed, there are frequently good reasons for policy to deviate from such simple benchmarks. For example, in the early 1980s, the Volcker Fed was intent on lowering inflation from double-digit levels. During the 1990s, even with relatively tight policy, a booming equity market was keeping financial conditions relatively loose. On other occasions, financial stress prompted the need for rapid policy easing in anticipation of future inflation and unemployment developments. However, by our reckoning, the rule suggests that policy today is more accommodating than it has been for more than 40 years. In the past, when policy stayed so accommodative, inflation took off.
Importantly, financial markets do not expect the Fed to catch up to the policy rates implied by the benchmark rule. The following chart, based on information from futures markets, shows market-implied estimates of the federal funds rate target through early 2023. (The dates refer to Federal Open Market Committee meetings.) We plot both the expected value and the median based on the probability distribution. In both cases, we assume the federal funds rate is at the center of the target range. For example, over the period to the next meeting on December 15, markets assign a 100% probability to the target range remaining at 0 to 0.25%, which we label as 12.5 basis points. The chart makes clear that market participants expect the policy rate to remain unchanged until June 2022, and for there to be rate increases cumulating to only 75 basis points over the coming 14 months.
Futures Market Estimates of the Federal Funds Rate Target, 2021-2023

Note: We plot the expected value and the median based on the histogram from the federal funds rate futures market, assuming that the rate is equal to the center of the target range.
Source: CME FedWatch Tool, accessed on November 16, 2021; and authors’ calculations.
In this environment, the obvious concern is that inflation will remain sufficiently high to raise longer-term expectations. So far, five-year forward five-year inflation expectations (computed from the difference between nominal and inflation-index bond yields) remain at 2.3%, only one-tenth of a percentage point above the median for the past decade. But, while investors are still unphased, blaring headlines are compelling public attention. Indeed, a crude measure of inflation’s salience comes from an index of Google searches for “inflation”—now roughly 2½ times their pre-pandemic level. The message is that, even though less than 30 percent of the current adult population was over 18 when inflation last hit 6 percent in 1982, everyone is now aware that prices are rising quickly.
Google Searches that include the term “inflation” (monthly) 2004- November 2021

Source: Google Trends, accessed on 15 Nov 2021. Data for the final November 2021 point are incomplete.
So, what should the Fed do? Based on the September Summary of Economic Projections (SEP) and consistent with futures market expectations, their favored path seems to be to wait well into 2022 before raising rates, hoping that inflation will fall back toward 2% on its own. That would leave policy extremely expansionary.
In our view, this stance does not balance the risks the Fed now faces. The largest potential cost, in our view, would be a loss of central bank credibility with both financial market participants and the public at large. On the first, we can imagine a plunge in demand for bonds that sharply boosts Treasury yields. To see what we mean, consider that at this writing the 10-year Treasury yield is roughly 1.6 percent. If market participants were to lose faith in the Fed’s commitment to deliver 2 percent inflation on average over time, the 10-year yield could easily surpass 3 percent. On the second, as former Treasury Secretary Summers aptly notes in the opening quote, when inflation rises, everyone is unhappy. What he need not explicitly say is that that this dissatisfaction will precipitate a loss of faith in the Fed.
Our conclusion is that the Fed needs to change course quickly. We hope that at their December meeting policymakers make two things clear. First, rate hikes do not need to wait for the end of the large-scale asset purchases. Second, unless inflation subsides sharply, they will start the process of policy normalization soon. Over time, that will mean raising interest rates above the longer-run norm (perhaps 2.5%) until they are again confident that their 2 percent inflation target is clearly in view.
Put differently, Fed policymakers need to shrink the policy rate gap—and the sooner they start, the more likely they will do it in a way that sustains the expansion.