

“The only way we could have saved Lehman would have been by breaking the law.” Ben S. Bernanke, Testimony to the Financial Crisis Inquiry Commission, September 2, 2010 (cited by Reuters).
“Lehman actually did have ample collateral for a loan that would have averted its sudden bankruptcy.” Laurence Ball, The Fed and Lehman Brothers, 2018, page xii.
Ten years ago this month, the run on Lehman Brothers kicked off the third and final phase of the Great Financial Crisis (GFC) of 2007-2009. In two earlier posts (here and here), we describe the prior phases of the crisis. The first began on August 9, 2007, when BNP Paribas suspended redemptions from three mutual funds invested in U.S. subprime debt, kicking off a global scramble for safe, liquid assets. And the second started seven months later when, in response to the March 2008 run on Bear Stearns, the Fed provided liquidity directly to nonbanks for the first time since the Great Depression, completing its crisis-driven evolution into an effective lender of last resort to solvent, but illiquid intermediaries.
The most intense period of the broadest and deepest disruption of U.S. and European finance since the Great Depression began with the failure of Lehman Brothers on September 15, 2008. Credit dried up; not just uncollateralized lending, but short-term lending backed by investment-grade collateral as well. In mid-September, measures of financial stress spiked far above levels seen before or since (see here and here). And, the spillover to the real economy was rapid and dramatic, with the U.S. economy plunging that autumn at the fastest pace since quarterly reporting began in 1947.
In our view, three, interrelated policy responses proved critical in arresting the crisis and promoting recovery. First was the Fed’s aggressive monetary stimulus, including the introduction of unconventional policy tools, such as quantitative easing, targeted asset purchases, and forward guidance, at the effective lower bound for interest rates. After Lehman, within its mandate, the Fed did “whatever it took” to end the crisis. Second was the use of taxpayer resources—authorized by Congress—to recapitalize the U.S. financial system. And third, was the exceptional disclosure mechanism introduced by the Federal Reserve in early 2009—the first round of macroprudential stress tests known as the Supervisory Capital Assessment Program (SCAP)—that neutralized the worst fears about U.S. banks.
In this post, we begin with a bit of background. Consistent with the widespread belief that well-grounded worries about solvency were the ultimate source of the crisis, we highlight the aggregate capital shortfall of the U.S. financial system. We then turn to the policy response. Because we have discussed unconventional monetary policy in some detail in previous posts (here and here), our focus here is on the stress tests (combined with recapitalization) as a central means for restoring confidence in the financial system.
The Capital Shortfall
When writing about the final phase of the crisis, one is naturally drawn to the Lehman bankruptcy as the direct cause of the extraordinary dislocations that followed. A number of things happened in the immediate aftermath of the Lehman failure: the LIBOR-OIS interest rate spread—the standard thermometer of the crisis that incorporates risk premia both for liquidity and credit— spiked (see chart); and a number of major financial markets, including those for repo, commercial paper, foreign exchange, and structured credit, either collapsed or (in the case of foreign exchange and the Treasuries market) experienced large price distortions (see, for example, here and here).
Three-month LIBOR-OIS interest rate spreads (basis points), 2007-2009

Note: The three vertical lines denote the BNP Paribas (August 9, 2007), Bear Stearns (March 14, 2008) and Lehman (September 15, 2008) events, respectively. Source: Bloomberg.
This timing naturally invites the question: Was Lehman really insolvent? Federal Reserve officials—like former Chairman Bernanke cited above—have long argued that, because they lacked confidence that Lehman could repay, the Fed was legally prohibited from lending to it. Numerous outside observers also have made a strong case for Lehman’s insolvency (see, for example, here and here). Nevertheless, after an exhaustive analysis, Ball comes to the opposite conclusion (see his monograph here and our discussion here).
In our view, whether Lehman was bankrupt or nearly so is largely beside the point. Central bank lending to an institution of doubtful solvency is little different from lending to one that is certainly so. In this case, lending to Lehman, a firm that was widely believed to be bankrupt, would have tarnished everyone else, leaving the system vulnerable.
More importantly, there were a whole host of Lehman’s just waiting for an adverse shock to hit the system. That is, the ongoing plunge of prices for housing and housing-related debt had created an extreme capital shortfall among leveraged intermediaries that rendered the entire system highly fragile. Within a week of Lehman’s failure, the 70-year-old business model of the large, powerful and independent investment bank (created following the Glass-Steagall Act of 1933) was over. In this context. Lehman’s only real hope for survival had been to find a buyer (as Bear did with Fed support in March 2008). Lehman’s failure to do so in the six months after Bear reflected both its own fragile condition and the lack of capital in the system as a whole.
Evidence of this systemic fragility is fairly easy to find. For example, by the end of August 2008, an index of stock prices of large U.S. banks already had plunged by more than 40 percent from its early-2007 peak (peak-to-trough, from January 2007 to February 2009, the index dropped by 80 percent; see chart). This collapse revealed investors’ skepticism about the health of U.S. banks and other intermediaries.
KBW stock price index of large U.S. banks (end-month observations), 2006-09

Source: Bloomberg.
This conclusion is confirmed by our preferred measure of the capital shortfall in the U.S. financial system—a domestic measure of aggregate SRISK provided by the NYU Stern Volatility Lab—which peaked shortly before Lehman’s failure (see chart). A forward-looking gauge that is based on the market, rather than book, value of an intermediary’s equity, SRISK rises with leverage, volatility, and the conditional correlation of a stock’s returns with that of the market in a “bad state” of the world. With investors anticipating substantial housing-related writedowns, plunging equity prices, rising volatility and increasing correlation associated with the scramble for safe assets all drove SRISK higher. As the chart shows, this measure of systemic risk began its sustained decline only after the Fed published the results of the first round of stress tests in May 2009.
U.S. aggregate SRISK (end-month, billions of dollars), 2006-10
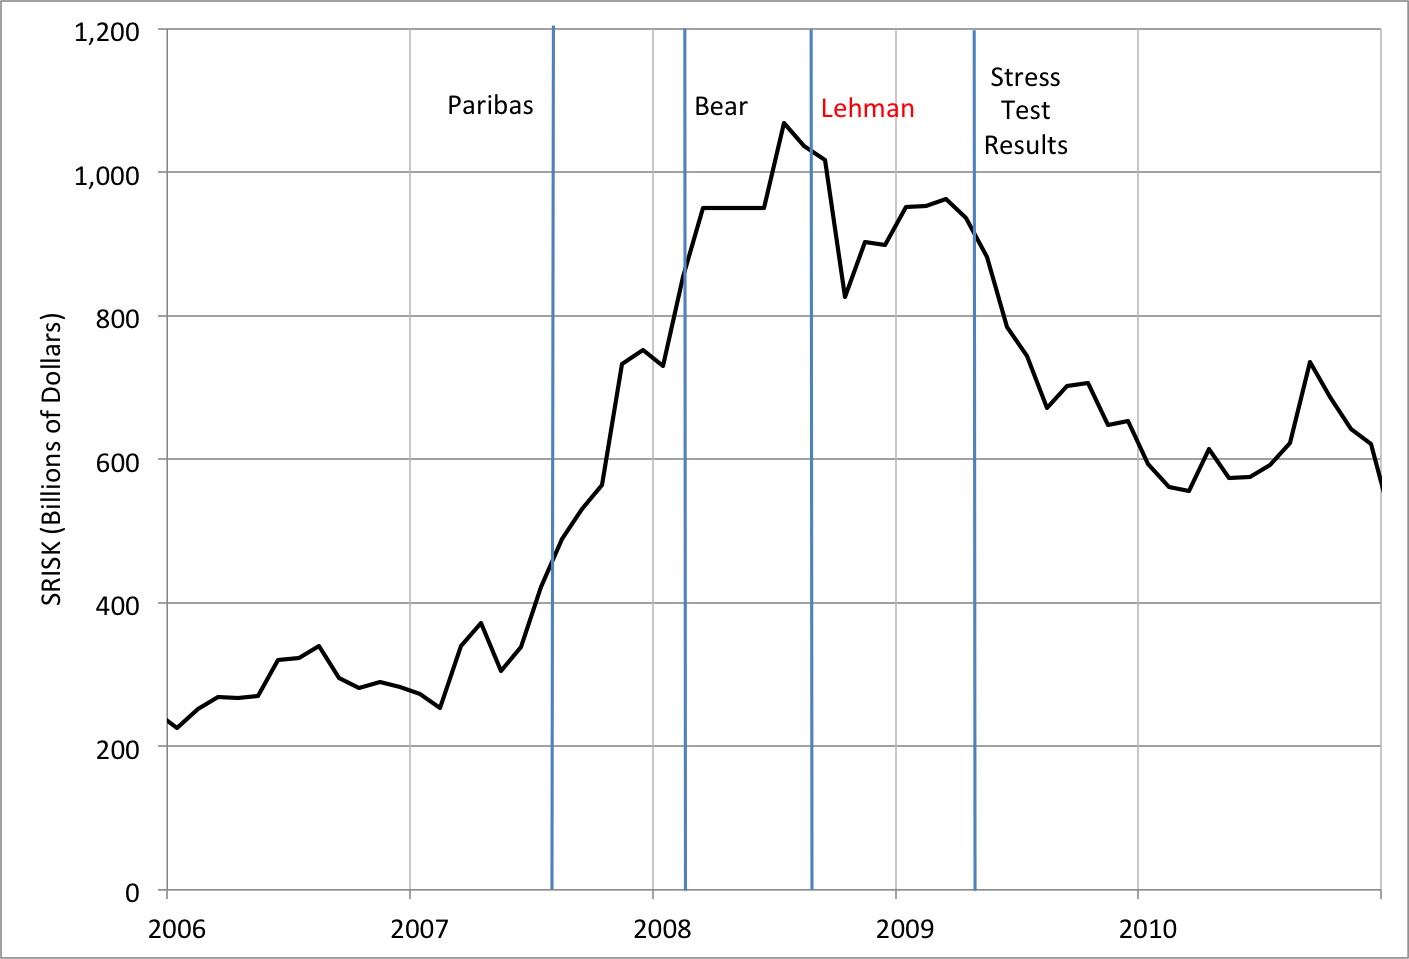
Source: NYU Stern Volatility Lab, which kindly provided data based on its U.S. MES model.
The V-Lab’s institution-by-institution estimates of SRISK highlight the concentration of the capital shortage among a few large intermediaries (see chart). As of end-August 2008—two weeks before Lehman failed—just six institutions (including the two GSEs, Fannie Mae and Freddie Mac) were responsible for more than half of the system’s capital shortfall. Of the top 10 non-GSE firms ranked by end-August SRISK, two subsequently failed outright (Lehman and Washington Mutual), two were merged into larger banks (Merrill Lynch and Wachovia), and the remaining six received federal government capital injections ranging from $10 billion to $68 billion (see here).
U.S. SRISK by firm (billions of dollars), August 29, 2008

Note: With aggregate SRISK close to $1 trillion as of August 29, 2008, the chart shows that $100 billion of SRISK corresponding to about 10 percent of the total. Source: NYU Stern Volatility Lab.
Forward-looking simulations provide yet another means for estimating how little capital there was in banking system at the height of the crisis. In an April 2009 report—that is, after the U.S. government had injected hundreds of billions of dollars into the banks—the IMF examined a sample of U.S. and European banks. They proceeded to estimate the writedowns and net earnings that would come from a recession scenario in 2009 and 2010—compared to end-2008 (see table). By themselves, the expected writedowns were sufficient to wipe out what capital was remaining in the U.S. and euro-area banks. However, given anticipated net earnings, things looked slightly better, so the overall estimate was that banking system leverage ratios would be roughly 2 percent. That is, given the anticipated loan performance and assuming some profitability, we could expect bank assets to be roughly 50 times equity capital at the end of 2010! It is surely no surprise that a number of key institutions were seen to be bordering on insolvency (again, even after sizable government capital injections).
IMF bank equity requirement analysis (billions of dollars, unless shown), April 2009

Source: IMF Global Financial Stability Report, April 2009, Table 1.4, page 36. Notes: The leverage ratio is the ratio of total common equity to total assets. The authors’ calculation of the drain-adjusted leverage ratio is based on an interpolation using the IMF estimated change between the end-2008 leverage ratio and the writedown-adjusted leverage ratio as well as the reported expected writedowns and the net drain on equity.
Our conclusion is that the failure of Lehman may have been the spark, but without the abundant supply of dry tinder, there would have been no conflagration. In the absence of aggressive and coordinated policy actions, it was just a matter of time before something started the great fire.
The Policy Response
Having confirmed the woefully inadequate capitalization of the financial system, the Lehman shock undermined the function of key financial markets, freezing credit supply and threatening an economic depression with severe deflationary consequences. Fortunately, the fire brought forth a fire brigade. By mid-2009, a wide range of economic policy responses had proven helpful in breaking the momentum of the crisis and setting the stage for recovery. We view three of these as critical.
Macroeconomic stabilization. The first was the macroeconomic stabilization effort that helped arrest the plunge in economic activity. It is no coincidence that financial conditions began to improve as the force of the recession receded in early 2009. Fiscal developments (including automatic stabilizers in 2008 and discretionary actions in 2009) played a role, but it is the “shock and awe” of unprecedented post-Lehman monetary actions that stand out.
Given the scale of the financial disruption, the Fed’s success in anchoring long-term inflation expectations was an immense and critical achievement, contrasting sharply with the deflationary experience of the Great Depression and of the 1990s in Japan. The central bank used a variety of means in this effort.
Immediately following the Lehman failure, the Fed began an unprecedented expansion of its balance sheet—the first and most important episode of quantitative easing (see chart). By mid-December, the balance sheet more than doubled. On the liability side, excess reserves at the central bank jumped by a factor of nearly 350, from $2.27 billion to $774.4 billion! In contrast with the inflationary fears of some critics, the Fed had learned from the experience of the Great Depression that preventing a collapse of the money stock and prices may require a ballooning of reserves (see here). As a part of its balance sheet expansion, in October, the central bank announced massive purchases of MBS to help support the dysfunctional market for housing finance and to limit the housing price plunge that was continuing to erode the capital of the financial system. Finally, after slashing its policy rate close to zero, in December 2008, to signal their intention to keep rates low for a prolonged period, the Federal Open Market Committee introduced explicit forward guidance.
Federal Reserve Assets by Type (Weekly, Billions of Dollars), 2007-2009

Notes: Lending to intermediaries includes the dollar swap lines, the Primary Dealer Credit Facility and the Treasury Auction Facility. The three vertical lines denote the BNP Paribas (August 9, 2007), Bear Stearns (March 14, 2008) and Lehman (September 15, 2008) events, respectively. Source: Federal Reserve Bank of Cleveland.
Recapitalizing the Banks. The second key post-Lehman policy action, again in sharp contrast to Japan’s slow and timid response in the 1990s, was the speedy and bold federal effort to recapitalize the financial system. For this purpose, Treasury initiated the Troubled Asset Relief Program (TARP) using funds Congress authorized on October 3, 2008, just weeks after Lehman. Over a mere three-month period, Treasury purchased $250 billion of equity (preferred stock with warrants) in more than 200 intermediaries, with the top 10 recipients accounting for more than three-fourths of the total capital infusion (for a complete list, see here). On top of TARP funds, Treasury backstopped the GSEs (which had been taken over September 6, 2008), committing up to $200 billion per enterprise, with the Congressional Budget Office estimating the taxpayer cost of the conservatorships at $389 billion (see here).
These Treasury recapitalizations served two distinct and essential roles. First, they kept investor sentiment from eroding even further, helping to limit the run on the financial system. And second, they provided sufficient confidence of solvency and ability to repay that the Fed could comfortably act as lender-of-last resort to intermediaries they may otherwise not have felt able to provide credit (as in the case of Lehman). Treasury’s actions also indirectly supported (and were supported by) the FDIC’s October 14 Temporary Liquidity Guarantee Program (TLGP) that guaranteed banks’ new issues of unsecured debt through 2012, helping to counter run risks during the recapitalization period.
Effective Stress Test. In February 2009, the Fed launched what would arguably become the world’s most successful financial stress test, as well as a milestone for supervision. Conducted under emergency conditions, the Supervisory Capital Assessment Program (SCAP) was an extraordinary disclosure program for the 19 largest banks. It sought to repair a dysfunctional financial system by persuading skeptical counterparties and investors that these key intermediaries were sufficiently resilient to withstand the ongoing crisis. In the end, SCAP helped overcome crisis-amplified information asymmetries, allowing previously suspect banks both to raise private capital and to borrow from other institutions and in markets.
In the first quarter of 2009, the immediate post-Lehman liquidity scramble had faded. Yet, intense financial strains remained (see here and here). These reflected, at least in part, persistent doubts about bank solvency despite Treasury’s recapitalization efforts. More broadly, financial conditions were extremely restrictive—with implied volatility still 4 to 5 times higher than the pre-crisis norm and key equity indexes continuing to decline.
It is worth keeping in mind that at least one earlier U.S. government effort at stress testing had failed spectacularly (see our discussion of pre-crisis GSE stress tests here). To be effective, SCAP needed to be transparent, forward-looking, and stressful. While SCAP’s adverse scenario quickly became the central outlook, it was not wildly optimistic (in contrast to the aforementioned GSE tests). Given the crisis setting, SCAP credibility also required the conviction of banks’ counterparties and potential investors that bank supervisors would truthfully reveal any inadequacies that SCAP uncovered. From this perspective, the continued availability of TARP funds to recapitalize weak banks was critical. Without this funding backstop, supervisors would not have been able to highlight individual institution weaknesses without fear of triggering a new run. Finally, repairing the systemwide capital shortfall without aggravating the credit crunch meant that U.S. regulators would have to compel over-leveraged banks to raise new capital rather than reduce their assets.
The most obvious success of the SCAP was that—immediately after the results were published in May 2009—large U.S. banks began to issue a large volume of equity to private investors for the first time since Lehman failed. By helping to diminish fears of widespread insolvency, SCAP made it possible for banks to address the severe debt overhang created during the pre-crisis credit boom without inducing a further fire sale of assets. Over the year following the disclosure of SCAP results, bank share prices generally rose even as the largest banks added more than $200 billion of common equity.
Conclusion
The Great Financial Crisis of 2007-2009 triggered the Great Recession and was followed by the weakest economic recovery in post-WWII experience. Observers have offered a range of plausible explanations for this nearly decade-long lackluster performance. For example, consistent with previous large debt cycles (see, for example, Jordà, Schularick and Taylor), it took years to unwind the credit mess created in the pre-crisis housing boom. Those credit problems also left persistent imprints on employment and household consumption (see Mian and Sufi). Others attribute the poor economic performance to secular factors (including demographics, slowing productivity growth, and declining business dynamism) combined with the limits of monetary policy at the effective lower bound (see Summers). Still others suggest that the lasting crisis-driven revision of perceived downside risks for the economy was sufficient to diminish the riskless interest rate, investment and economic growth on a persistent basis (see Kozlowski, Veldkamp and Venkateswaran).
While scholars will surely continue to debate the causes of the weak recovery for years to come, one thing is certain: it could have been much worse. Without the aggressive economic stabilization policy, speedy government-led recapitalization of the financial system, and innovative bank supervision, we probably would have had a second Great Depression. Given the inevitability of financial crises, these are policy lessons that we must not forget: crisis management requires authorities that have the knowledge, authority, resources, and willingness to act quickly and decisively. It is essential that everyone be ready to do whatever it takes.