

A highly leveraged financial system is one prone to collapse. This notion underlies modern financial regulation: the control of systemic risk requires controlling leverage. And, it is what drives proposals for high capital requirements and to tax leverage. But, as is always the case with regulation, the devil is in the details. For one thing, we need a way to measure leverage. This turns out to be a surprisingly difficult task. Second, while risk varies positively with leverage, risk-taking can increase without increasing leverage, so we need to think about all major forms of risk-taking that can threaten financial stability.
Before we dive into a discussion of accounting principles—and that’s where we are going—it is worth making a few general comments about leverage. We are all familiar with leverage in the context of borrowing to purchase an asset. Take the simple example of someone who purchases a house with a loan equal to 80% of the value. Since the homeowner put down 20%, that ratio of equity to the value of the house is their leverage ratio. Now, the implications of this are profound: for each percentage point change in the house price, the value of the owner’s share changes by five percentage points. That is, leverage magnifies the return by the inverse of the leverage ratio. The same thing happens to the standard deviation. (For a discussion of the importance of leverage, see here.)
Common measures of leverage exploit the intuition in this very simple example: they take net worth (assets minus liabilities) and divide by total assets. According to the Financial Accounts of the United States, banks collectively borrow about $8.00 of debt for every dollar of equity, while nonfinancial corporations borrow $0.80 and households borrow only $0.25 (see our Primer on Bank Capital).
But borrowing to boost leverage is only one way to increase risk exposure. Another is to through derivatives. To see how this works, consider the straightforward example of a futures contract for a $100,000 10-year U.S. Treasury note. The Chicago Board of Trade requires an initial margin of $1,350 per contract. That is, with an investment of only $1,350, an investor can obtain the same dollar return as the purchase of $100,000 worth of bonds. This risk exposure is equivalent to a leverage ratio of 1.35%. To see what this means in practice, note that at the current 10-year yield of roughly 1.9% the 10-year Treasury note on which the futures contract is based has a duration of 8 years. This means that a 1-basis-point change in the yield moves the price by $80. That price change generates a return of 0.08% to the owner of the $100,000 bond, but it represents a return of nearly 6% for the futures contract purchaser who posts the minimum margin.
The point is that—for every given measure of leverage—derivatives allow one to increase risk exposure in a big way. Thinking about this leads to a concept of portfolio sensitivity that one might call marginal leverage. This is the degree to which net worth changes when the price of assets changes. More technically, marginal leverage is the derivative of a portfolio’s value with respect to an asset price change. In the case of the Treasury note futures example, this is roughly 74. The lesson is that derivatives can dramatically increase the sensitivity of a firm’s capital to changes in asset prices, increasing their marginal leverage.
To be sure, not all derivatives positions increase risk. When derivatives are used to hedge, they can reduce risk. And, there are classic examples where both the short and the long position in a derivative are both hedging—think of a farmer who sells a wheat futures contract to a flour miller. But as we noted in an earlier post, the data as of mid-2015 show over-the-counter gross notional derivatives outstanding of about $550 trillion globally. Of this, over $200 trillion—nearly half—is on the balance sheets of the five largest American banks: JP Morgan Chase, Bank of America, Citigroup, Goldman Sachs and Morgan Stanley (ranked by the size of their end-2015 derivatives portfolios).
Now, banks usually report that their derivatives portfolios are hedged to manage risk. That is probably the norm, but it’s difficult for an outsider to see through the black box. Is it really true that banks with large derivatives positions are no more risky than those with small positions? Or, might they be using these instruments to conceal large amounts of risk so that it doesn’t show up in conventional measures of leverage?
One might hope that some sort of accounting convention can help us to address this shortcoming. To see, we can have a look at how derivatives positions are treated in the computation of more conventional leverage ratios. Here, the two most common accounting standards—U.S. generally accepted accounting principles (GAAP) and International Financial Reporting Standards (IFRS) —give different answers. And the difference really matters.
Before getting to some numbers, it is useful to actually explain where the difference arises. Under GAAP, an institution may use collateral it receives from a counterparty to offset a derivatives exposure. Under IFRS, it cannot. What this means is that if a bank has a derivative with a market value of $100 and receives collateral from the counterparty worth $90, the borrowing (which affects the leverage ratio) under GAAP is only ($100-$90)=$10, while under IFRS, it is $100.
The argument for allowing netting is that the $90 in cash collateral received is effectively a payment to cover the exposure and should therefore be netted (see, for example, here.) The argument for not allowing netting is that the collateral received can be re-used to leverage up the bank. That is, cash collateral can be on-lent, while non-cash collateral can be either on-lent or sold.
To put our cards on the table, we are soundly in the IFRS camp. The idea of netting strikes us as similar to saying that a bank with a legal right to a particular security or loan should be allowed to net the value of that asset off against a deposit or bond liability. But that runs counter to the whole idea of a leverage ratio that is based on holding the value of the liability unchanged when the value of the asset goes up or down, leading to a change in net worth. For a derivative, unless the collateral is always available to sell, of the highest liquidity, and never re-hypothecated, the same principle ought to hold. Even then, we should keep in mind that just because a derivative contract represents a hedge when the counterparty is solvent, it may conceal an open exposure when the counterparty is not.
Turning to the details, the Global Capital Index constructed by FDIC Vice Chair Thomas Hoenig and his colleagues allows us to see how much this particular aspect of derivatives accounting matters for computation of a simple leverage ratio. For the past four years, the Index has provided capitalization ratios for the 30 banks designated as globally systemically important (G-SIBs) by the Financial Stability Board. For each of the eight U.S. banks on the list, we collected information on the notional value of their derivative assets in recent years. The following chart shows the IFRS-based leverage ratio plotted against the size of derivatives positions for the five banks listed above plus Wells Fargo, Bank of New York Mellon, and State Street.
U.S. G-SIB banks: IFRS leverage and the notional value of derivative assets, 2012 to 2015
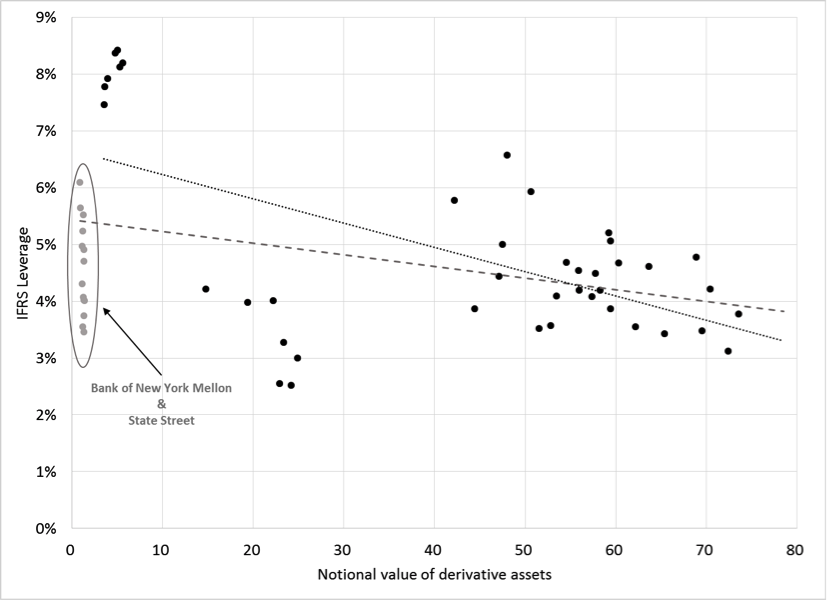
Sources: FDIC, Global Capital Index; 10-Q and 10-K filings; and authors’ calculations. Note that there are several observations over time for each of the eight U.S. G-SIBs.
Looking at this picture we see that State Street and Bank of New York Mellon are extremely different from the others: at roughly $1 trillion, their derivatives positions are much smaller. Excluding those two, the implication is that the larger the notional value of a bank’s derivative position, the lower their IFRS leverage ratio. This is consistent with the simple idea that a larger gross derivatives position makes a firm riskier. It also is consistent with the idea that firms are not fully hedged against the failure of a major counterparty. Quantitatively, the solid regression line in the chart suggests that for each $10 trillion in derivatives, the leverage ratio falls by roughly 0.4 percentage points.
But the main point—and one made by Vice Chair Hoenig in a recent speech—is that derivatives allow banks that use GAAP to conceal risk. To see how much this might be the case, we constructed a second chart (see below). On this one, the vertical axis is the difference between the GAAP-based leverage ratio and the IFRS-based leverage ratio. So, for example, at the end of 2015, Goldman Sachs reported a GAAP leverage ratio of 9.22%. The FDIC computed that the corresponding IFRS-based measure was only 5.00%. At the same time, Goldman Sachs’ 10-K reports that the notional value of their derivative assets was $47.5 trillion. In the following plot, this is the point (4.22%, $47.5 trillion).
U.S. G-SIB banks: Differences in leverage measures (GAAP minus IFRS) and the notional value of derivative assets (trillions of U.S. dollars), 2012 to 2015
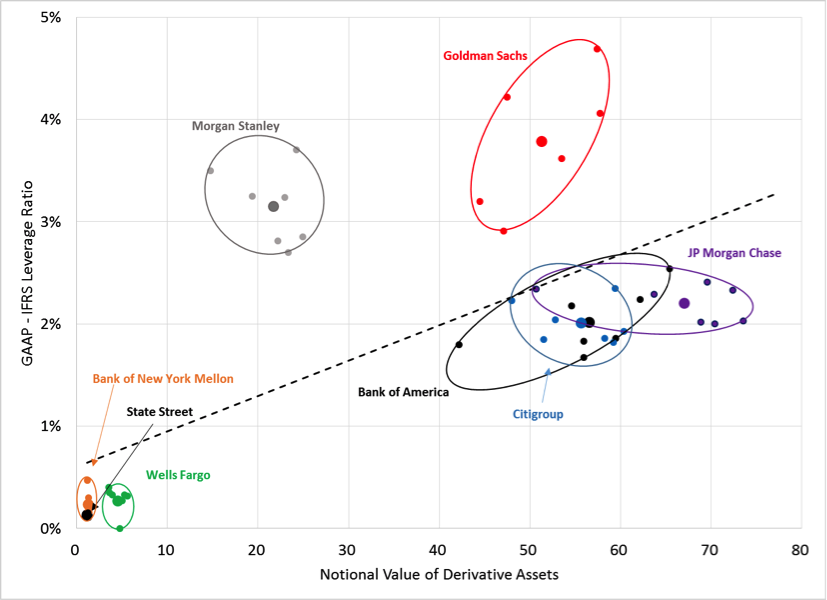
Sources: FDIC, Global Capital Index; 10-Q and 10-K filings; and authors’ calculations.
Each of the banks appears in a separate color, with ellipses drawn to encompass all of the observations for each bank. The dashed line, which is the regression through the bank-specific means, has a slope of roughly 3 basis points. This means that a $10 trillion increase in a bank’s derivatives book corresponds to a rise in the difference between the GAAP and IFRS leverage measures of 0.3 percentage points.
Looking more carefully at the chart, we are tempted to say that banks higher up—those with a larger difference between the two measures—are more likely to be using their derivatives books to conceal risk. Morgan Stanley (gray) and Goldman Sachs (red) stand out. On the other end, State Street (black), Bank of New York Mellon (orange) and Wells Fargo (green) are not playing this particular game. For the others, we see that the variation over time in JP Morgan Chase’s derivative positions (purple) is unrelated to the leverage gap, suggesting that their derivatives business is driven by something other than the desire to take on risk. Citigroup’s pattern reveals little. By contrast, the positive slope over time of the Bank of America (black) observations is consistent with using derivatives positions to manage its apparent leverage.
Where does this leave us? First, large banks tend to have very large off-balance-sheet positions that collectively account for most of the over-the-counter derivatives outstanding. This can leave them massively exposed to the failure of a large derivatives counterparty. Second, the difference between measures of leverage is positively related to the size of banks’ derivatives books. This leaves us wondering whether some banks are using these massive positions to conceal risk. And, it leads us to conclude that proposals to tax leverage should be proposals to tax the systemic risk-taking (or marginal leverage) of an institution in its entirety, including both on- and off-balance-sheet exposures and including exposures both on the asset and the liability side of the balance sheet.
Figuring out how to do that is an immense task that is both pressing and important.